Preprint Seven replicated genomic associations of myalgic encephalomyelitis/chronic fatigue syndrome: a biobank study, 2026, Slaughter, Ponting et al.

I see it as a positive that this work was done and published. We know previous work on UK biobank data only identified one variant for females. It seems to matter how you identify the patient cohort. What surprised me was replication in a completely unrelated study in the US. 5 of the replicated variants in this paper were from the All of Us program data.

There are details on patient and control selection in the Stanford Symposium video so look out for that when published on youtube for those of us that can't fully digest a paper..

I'd be interested to learn more from @Chris Ponting about the comparison of using the 5x10⁻⁸ level vs the FDR level for analysing genes. I didn't quite understand that in the presentation given that Chris has always talked about the importance of meeting the 5x10⁻⁸ p value threshold.
 
What surprised me was replication in a completely unrelated study in the US. 5 of the repilcated variants in this paper were from the All of Us program data.
I was surprised too. They started from a discovery case cohort less than a tenth the size of DecodeME, and presumably with a more heterogenous cohort (though maybe not?) and were able to detect significant variants that replicated in a different country.
 
Same. Wondering now if this could all be self consistent if the cohorts in this new study are people genetically predisposed to a less severe illness and one with an older onset, thus these variants are *less* aggressively selected against evolutionarily and were easier to find even in a smaller gwas. (mostly inspired by this paper jnmaciuch shared a while ago on complex traits being selected against in a way that makes them hard to find in studies)
 

CSMD1 might play a role in complement regulation, schizophrenia, and synaptic regulation:

The Schizophrenia-Associated Gene, CSMD1, Encodes a Brain-Specific Complement Inhibitor (Baum, 2018, Dissertation)
a) a genome-wide significant association [with schizophrenia] signal localizes to CSMD1,

b) the gene encodes a protein composed almost entirely of protein domains conserved in inhibitors/regulators of the complement cascade, i.e., CUB (Complement, Urchin-EGF, Bone-Morphogenic protein) and Sushi (aka CCP or Complement Control Proteins) domains,

c) protein fragments of CSMD1 can directly and indirectly inhibit the activation of C4 and C3 in vitro,

d) CSMD1 mRNA is brain-enriched.

Despite these intriguing observations, however, little was known about the about the normal functions of CSMD1 in neural tissues. Here, we show that CSMD1 protein is highly brain enriched, is most pronounced in cortex, present at synapses, and is expressed predominantly by neurons.

Using a human stem cell line and a mouse each genetically lacking CSMD1, we present evidence that CSMD1 regulates complement activation on neural cells and in vivo, and that loss of Csmd1 abrogates the development of a complement-and-pruning-dependent neural circuit.

Together, these data corroborate CSMD1 as a brain-specific complement inhibitor.

PubMed results for CSMD1 include findings related to neurodevelopmental disorders, cancer progression, schizophrenia, mammary duct formation, fertility, malaria, and more.
 
I see it as a positive that this work was done and published. We know previous work on UK biobank data only identified one variant for females. It seems to matter how you identify the patient cohort. What surprised me was replication in a completely unrelated study in the US. 5 of the replicated variants in this paper were from the All of Us program data.

There are details on patient and control selection in the Stanford Symposium video so look out for that when published on youtube for those of us that can't fully digest a paper..

I'd be interested to learn more from @Chris Ponting about the comparison of using the 5x10⁻⁸ level vs the FDR level for analysing genes. I didn't quite understand that in the presentation given that Chris has always talked about the importance of meeting the 5x10⁻⁸ p value threshold.
Thank you for this question. The p<5x10⁻⁸ threshold is, indeed, the "industry-standard" used for GWAS. The reason why we did not apply this threshold is that it was set using results from more conventional GWAS methods, specifically linear/logistic models. TarGene is different (in ways described here: https://pmc.ncbi.nlm.nih.gov/articles/PMC12479317/) so we should not unthinkingly apply the same threshold. Thus, we decided to apply a conventional false discovery rate threshold, and then seek to replicate associations meeting this threshold in independent cohorts. Hope this helps!
 
Interesting analysis, thanks to the authors!

I find it strange that the analysis of 1,268 ME/CFS cases found more significant hits (SNPS with p < 5 * 10^-8) than DecodeME with 15,579 cases (and double the amount of controls). The effective sample size was only around 5000. This doesn't fit with the low heritability that DecodeME found.

My first guess would be that a genomic inflation factor of 1.09 might not be modest for this tiny sample size and that might include some bias. Would be interesting to hear what the LDSC intercept was.

Another potential reason might be that the 15 significant SNPs were quite rare, with a MAF of around 1%, so they might depend on just a small number of individuals.


1789474191019.webp
 
Another potential reason might be that the 15 significant SNPs were quite rare, with a MAF of around 1%, so they might depend on just a small number of individuals.
Maybe low minor allele frequency is the reason. I just did a quick calculation of MAF for cases and controls from supplementary table 1:

I couldn't fit all 176 variants in the post, so this is only the 100 most significant. The first four columns are copied from Supplementary Table 1, and the MAF columns are calculated by me from the genotype counts.
rsIDp-valuecase_geno_countsctrl_geno_countsCase MAFControl MAF
rs1153496037.2E-10A/A:1250 A/G:15 G/G:0A/A:110030 A/G:2946 G/G:90.0060.013
rs45255952.6E-09G/G:1248 G/A:17 A/A:1G/G:109283 G/A:3474 A/A:210.0080.016
rs1172901483.4E-09G/G:1252 G/C:13 C/C:0G/G:110099 G/C:2794 C/C:200.0050.013
rs755529053.5E-09A/A:1247 A/G:18 G/G:0A/A:109651 A/G:3252 G/G:290.0070.015
rs360694124.5E-09A/A:1231 A/G:34 G/G:0A/A:106566 A/G:6209 G/G:880.0130.028
rs790254315.3E-09T/T:1213 T/C:52 C/C:1T/T:104770 T/C:8008 C/C:1460.0210.037
rs42710436.7E-09G/G:1251 G/A:14 A/A:0G/G:109998 G/A:2845 A/A:150.0060.013
rs1166231051.2E-08G/G:1248 G/T:16 T/T:0G/G:109246 G/T:3234 T/T:00.0060.014
rs776085281.6E-08T/T:1250 T/G:17 G/G:0T/T:109826 T/G:3255 G/G:230.0070.015
rs285521031.6E-08G/G:1237 G/A:19 A/A:1G/G:109091 G/A:3311 A/A:260.0080.015
rs731179351.7E-08C/C:1247 C/T:19 T/T:1C/C:109694 C/T:3268 T/T:200.0080.015
rs1177421803.3E-08A/A:1200 A/G:65 G/G:0A/A:103162 A/G:9628 G/G:2080.0260.044
rs79143.6E-08A/A:805 A/G:424 G/G:34A/A:67460 A/G:39534 G/G:58310.1950.227
rs1155693553.8E-08A/A:1238 A/C:25 C/C:1A/A:108666 A/C:4178 C/C:350.0110.019
rs729263104.9E-08A/A:1239 A/G:25 G/G:0A/A:108314 A/G:4518 G/G:00.0100.020
rs561142676.3E-08C/C:1240 C/G:26 G/G:1C/C:108280 C/G:4686 G/G:520.0110.021
rs121184058.0E-08T/T:1234 T/C:28 C/C:0T/T:108011 T/C:4703 C/C:490.0110.021
rs730467998.3E-08A/A:1252 A/G:15 G/G:0A/A:110022 A/G:2994 G/G:200.0060.013
rs800113381.2E-07A/A:1241 A/C:25 C/C:0A/A:108673 A/C:4164 C/C:340.0100.019
rs12071201.4E-07G/G:889 G/A:360 A/A:16G/G:78259 G/A:31393 A/A:31170.1550.167
rs786134831.5E-07A/A:1253 A/G:13 G/G:0A/A:110622 A/G:2457 G/G:120.0050.011
rs756474051.5E-07A/A:1246 A/C:15 C/C:0A/A:109626 A/C:3117 C/C:200.0060.014
rs727693081.9E-07G/G:1195 G/A:27 A/A:0G/G:104346 G/A:4424 A/A:430.0110.021
rs125512092.0E-07A/A:948 A/G:297 G/G:13A/A:80761 A/G:29375 G/G:26380.1280.154
rs65023142.3E-07A/A:895 A/G:356 G/G:15A/A:77748 A/G:31845 G/G:30910.1520.169
rs783035002.4E-07T/T:1252 T/C:15 C/C:0T/T:109829 T/C:3119 C/C:190.0060.014
rs1160488252.5E-07T/T:1126 T/C:17 C/C:0T/T:99037 T/C:3133 C/C:210.0070.016
rs731641322.9E-07A/A:1240 A/G:24 G/G:0A/A:108528 A/G:4396 G/G:420.0090.020
rs1175534932.9E-07T/T:1239 T/C:26 C/C:1T/T:108411 T/C:4629 C/C:450.0110.021
rs104913343.0E-07T/T:821 T/C:417 C/C:28T/T:71806 T/C:36477 C/C:47550.1870.203
rs23609973.0E-07C/C:14 C/G:367 G/G:881C/C:3097 C/G:31056 G/G:786740.1560.165
rs415547143.3E-07C/C:1250 C/T:15 T/T:0C/C:110146 C/T:2751 T/T:240.0060.012
rs803033053.9E-07G/G:1252 G/A:14 A/A:0G/G:110198 G/A:2782 A/A:110.0060.012
rs71660974.1E-07C/C:38 C/T:441 T/T:787C/C:6079 C/T:39859 T/T:669180.2040.230
rs357582274.3E-07G/G:1235 G/A:30 A/A:0G/G:108418 G/A:4522 A/A:380.0120.020
rs802040844.6E-07C/C:1246 C/A:16 A/A:1C/C:110205 C/A:2542 A/A:160.0070.011
rs790306145.1E-07C/C:1240 C/T:25 T/T:0C/C:108837 C/T:4048 T/T:310.0100.018
rs753120505.4E-07G/G:1251 G/A:15 A/A:0G/G:110495 G/A:2513 A/A:360.0060.011
rs1167065415.8E-07T/T:1235 T/C:13 C/C:1T/T:109585 T/C:2316 C/C:170.0060.010
rs753183005.9E-07C/C:878 C/A:362 A/A:16C/C:79247 C/A:30269 A/A:29290.1570.161
rs727416546.5E-07T/T:1234 T/C:29 C/C:0T/T:107826 T/C:4718 C/C:580.0110.021
rs15344426.7E-07C/C:743 C/T:482 T/T:37C/C:67352 C/T:39657 T/T:58760.2200.228
rs731952426.8E-07T/T:1237 T/C:23 C/C:0T/T:108347 T/C:4244 C/C:710.0090.019
rs1167387457.4E-07G/G:1250 G/A:16 A/A:0G/G:110035 G/A:2855 A/A:160.0060.013
rs116062047.5E-07A/A:1181 A/G:83 G/G:3A/A:101824 A/G:10937 G/G:2720.0350.051
rs1178492267.5E-07G/G:1245 G/A:20 A/A:1G/G:109417 G/A:3513 A/A:290.0090.016
rs731983188.3E-07A/A:1243 A/G:23 G/G:0A/A:109154 A/G:3758 G/G:340.0090.017
rs26475458.4E-07A/A:906 A/G:345 G/G:14A/A:78863 A/G:30994 G/G:30750.1470.164
rs665582888.7E-07G/G:855 G/A:388 A/A:21G/G:74393 G/A:34569 A/A:39290.1700.188
rs1180006459.5E-07C/C:1250 C/T:14 T/T:0C/C:110356 C/T:2511 T/T:110.0060.011
rs774351651.0E-06A/A:1245 A/G:14 G/G:0A/A:110398 A/G:2270 G/G:100.0060.010
rs118253811.1E-06G/G:804 G/A:428 A/A:24G/G:73068 G/A:34897 A/A:42140.1890.193
rs623858061.2E-06T/T:1234 T/C:29 C/C:1T/T:108094 T/C:4888 C/C:430.0120.022
rs1169377771.2E-06T/T:1248 T/A:16 A/A:0T/T:110183 T/A:2725 A/A:120.0060.012
rs75172601.2E-06A/A:58 A/G:542 G/G:665A/A:8379 A/G:44120 G/G:603230.2600.270
rs1174473971.4E-06G/G:1247 G/T:18 T/T:0G/G:110470 G/T:2536 T/T:210.0070.011
rs66642531.7E-06A/A:882 A/G:359 G/G:19A/A:75568 A/G:33637 G/G:36400.1580.181
rs1169244941.8E-06A/A:1245 A/G:20 G/G:0A/A:109492 A/G:3400 G/G:280.0080.015
rs121216871.8E-06T/T:1242 T/G:25 G/G:0T/T:108622 T/G:4251 G/G:470.0100.019
rs1174309511.8E-06C/C:1237 C/T:26 T/T:0C/C:108613 C/T:4177 T/T:140.0100.019
rs770808601.9E-06C/C:1248 C/T:15 T/T:0C/C:110049 C/T:2830 T/T:120.0060.013
rs1437860572.0E-06C/C:1254 C/T:13 T/T:0C/C:110176 C/T:2690 T/T:220.0050.012
rs778937772.1E-06A/A:1244 A/G:21 G/G:1A/A:109281 A/G:3617 G/G:290.0090.016
rs176117842.1E-06T/T:1232 T/C:30 C/C:0T/T:108134 T/C:4537 C/C:380.0120.020
rs168226322.1E-06A/A:1251 A/G:15 G/G:0A/A:110675 A/G:2307 G/G:120.0060.010
rs31306022.2E-06T/T:1241 T/C:25 C/C:0T/T:108891 T/C:4147 C/C:440.0100.019
rs117351092.2E-06G/G:1230 G/A:27 A/A:1G/G:108176 G/A:4431 A/A:440.0120.020
rs787716252.2E-06T/T:1241 T/G:26 G/G:0T/T:108864 T/G:4190 G/G:400.0100.019
rs729390832.3E-06G/G:1249 G/A:17 A/A:0G/G:110146 G/A:2879 A/A:170.0070.013
rs1176753732.4E-06C/C:1246 C/A:15 A/A:0C/C:110237 C/A:2604 A/A:100.0060.012
rs1181417542.4E-06A/A:1248 A/G:16 G/G:0A/A:109867 A/G:3048 G/G:130.0060.014
rs1503211902.4E-06T/T:1126 T/C:19 C/C:0T/T:99196 T/C:3256 C/C:230.0080.016
rs620446792.4E-06T/T:1250 T/C:16 C/C:0T/T:110506 T/C:2426 C/C:120.0060.011
rs802884922.4E-06T/T:1209 T/G:56 G/G:0T/T:104817 T/G:8038 G/G:1580.0220.037
rs118009182.4E-06T/T:1211 T/C:56 C/C:0T/T:104772 T/C:8045 C/C:1750.0220.037
rs579003432.4E-06G/G:1198 G/A:22 A/A:0G/G:105161 G/A:3329 A/A:210.0090.016
rs789345652.5E-06A/A:1249 A/C:17 C/C:0A/A:109999 A/C:3065 C/C:90.0070.014
rs15344432.5E-06G/G:749 G/A:480 A/A:37G/G:67429 G/A:39689 A/A:58790.2190.228
rs730640702.6E-06A/A:1247 A/G:20 G/G:0A/A:109846 A/G:3205 G/G:230.0080.014
rs31289332.7E-06A/A:1239 A/G:25 G/G:0A/A:108752 A/G:4162 G/G:100.0100.019
rs92769692.7E-06A/A:1242 A/C:25 C/C:0A/A:108863 A/C:4153 C/C:470.0100.019
rs125294622.8E-06A/A:1143 A/G:117 G/G:6A/A:97810 A/G:14733 G/G:5340.0510.070
rs786162602.9E-06A/A:1199 A/G:62 G/G:3A/A:104675 A/G:8222 G/G:1590.0270.038
rs1169609952.9E-06T/T:1239 T/C:24 C/C:1T/T:108899 T/C:3985 C/C:280.0100.018
rs779683923.1E-06T/T:1239 T/C:28 C/C:0T/T:108564 T/C:4427 C/C:330.0110.020
rs171445663.1E-06T/T:809 T/C:431 C/C:26T/T:73700 T/C:35085 C/C:42410.1910.193
rs1506211173.2E-06G/G:1253 G/A:13 A/A:1G/G:110655 G/A:2394 A/A:150.0060.011
rs1177555213.4E-06G/G:1231 G/A:28 A/A:0G/G:107698 G/A:4330 A/A:290.0110.020
rs727217363.4E-06T/T:1243 T/C:24 C/C:0T/T:109458 T/C:3605 C/C:270.0090.016
rs347487213.5E-06G/G:1172 G/T:84 T/T:6G/G:100894 G/T:11506 T/T:3110.0380.054
rs747641253.5E-06G/G:1232 G/A:17 A/A:0G/G:108814 G/A:3047 A/A:10.0070.014
rs1173700673.6E-06A/A:1237 A/G:27 G/G:0A/A:108566 A/G:4308 G/G:310.0110.019
rs749630733.7E-06T/T:1246 T/C:21 C/C:0T/T:109834 T/C:3213 C/C:240.0080.014
rs76549693.8E-06G/G:1249 G/T:13 T/T:0G/G:110151 G/T:2358 T/T:110.0050.011
rs774896033.8E-06T/T:1249 T/C:17 C/C:0T/T:110233 T/C:2739 C/C:80.0070.012
rs776022543.8E-06A/A:1193 A/G:66 G/G:1A/A:103484 A/G:9119 G/G:2140.0270.042
rs3965673.9E-06C/C:76 C/A:353 A/A:830C/C:5427 C/A:38675 A/A:685440.2010.220
rs798938263.9E-06T/T:1225 T/C:35 C/C:2T/T:107376 T/C:5338 C/C:940.0150.024
rs105204064.0E-06C/C:1200 C/T:63 T/T:2C/C:104128 C/T:8624 T/T:1930.0260.040
rs121453464.1E-06A/A:942 A/C:293 C/C:13A/A:90280 A/C:19834 C/C:10820.1280.099
[TR]

Out of 176 significant variants, ~54% had an MAF < 0.02 based on allele counts of cases and controls combined.

I tried comparing to DecodeME by filtering to all the variants that cross a similar p-value threshold as this study (I used p<1.5e-5). Out of 3645 variants below this p-value in DecodeME, only 6 variants have an MAF < 0.02 (0.1%).

So maybe these are mostly artifactual findings related to low MAF. Here is a paper talking about this:

Data quality control in genetic case-control association studies (Anderson et al., 2010)
The final step in per-marker QC is to remove all SNPs with a very low MAF. Typically, a MAF threshold of 1–2% is applied, but studies with small sample sizes may require a higher threshold. The small sizes of the heterozygote and rare-homozygote clusters make these variants difficult to call using current genotype-calling algorithms; they frequently present as false positives in case-control association tests. Furthermore, even when accurately called, association signals observed at these rare SNPs are less robust because they are driven by the genotypes of only a few individuals. Given that the power to detect association with rare variants is so low23, their removal does not overly affect the study.
 
Last edited:
Interesting. How does that square with studies like sequenceME that specifically look for rare variants? I guess the genotyping used will be more reliable than what that quote is discussing for one thing.

Still really interesting there was a such a difference at all between the two studies.

only 6 variants have an MAF < 0.02 (0.1%)
does a MAF of 0.01 mean 0.1% or 1%?
 
I find it strange that the analysis of 1,268 ME/CFS cases found more significant hits (SNPS with p < 5 * 10^-8) than DecodeME with 15,579 cases (and double the amount of controls).
Is that right? I count 287 variants in DecodeME with p<5e-8. Based on the supplementary table in this study, there are only 15 variants that pass this threshold.

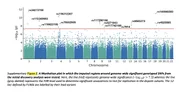
Edit: The 15 doesn't include the imputed variants in this study. Looking at Supplementary Figure 2, it looks like that brings it up to around 23 variants.
 
Last edited:
Interesting. How does that square with studies like sequenceME that specifically look for rare variants? I guess the genotyping used will be more reliable than what that quote is discussing for one thing.
Yes, more reliable genotyping, plus rare variants within a single gene are typically grouped together to increase statistical power. So the statistical test is per gene, not per variant.

does a MAF of 0.01 mean 0.1% or 1%?
Sorry, that wasn't clear. In DecodeME, 6 out of 3645 variants with p<1.5e-5 (about 0.1% of variants below this threshold) had an MAF less than 0.02 (or 2%).
 
Is that right? I count 287 variants in DecodeME with p<5e-8. Based on the supplementary table in this study, there are only 15 variants that pass this threshold.
I was thinking about (FUMA-defined independent) regions because many of those 287 variants were highly correlated and represented the same signal. It seems that there were 12 independent loci in this discovery cohort reaching the significance threshold, while there were only 6 in the main DecodeME analysis
 
I was thinking about (FUMA-defined independent) regions because many of those 287 variants were highly correlated and represented the same signal. It seems that there were 12 independent loci in this discovery cohort reaching the significance threshold, while there were only 6 in the main DecodeME analysis
Oh ok, makes sense. Yes, that's interesting.

Edit: Maybe the fact that the independent hits have few variants within each locus suggests that the most of the ones that passed the threshold were artifacts, because otherwise, I think we'd expect many other variants in the region that are in LD with each top hit to also pass the threshold, as we see in DecodeME, where there were more total SNPs per independent locus.
 
My takeaway from the presentation at the Stanford symposium was that the replicated findings are of most interest.

Does anyone have an inkling what the statistics of getting a 1% MAF hit by random in one dataset replicated in another dataset are? Gut feel tells me it should be rather rare.
 
My takeaway from the presentation at the Stanford symposium was that the replicated findings are of most interest.

Does anyone have an inkling what the statistics of getting a 1% MAF hit by random in one dataset replicated in another dataset are? Gut feel tells me it should be rather rare.

Here are the MAFs I calculated for just the seven replicated variants listed in Table 1:

rsIDNearest geneMAF (Full cohort)
rs115186419ETV50.021
rs73175505CSMD10.024
rs261902BICD10.192
rs117553493CLYBL0.020
rs72741654RORA0.017
rs74963073GRIN2A0.013
rs76847656SBK10.013

6 out of 7 of these have an MAF right around 1-2%. So I wonder if the reason most of the replicated variants had low MAFs could be because the low MAF variants were where most of the false positives happened.

---

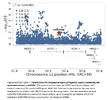
Separately, maybe I'm misunderstanding something, but Table 1 and the supplementary spreadsheet say the rs261902 variant had log10p = 4.85. But Supplementary Figure 7 seems to put it at around log10p = 2.

1789494490390.webp
 
One small observation I'd make from reading through so far - I haven't looked at the data itself - is that the control cohort wasn't merely defined by an absence of ME/CFS associated signals; it was also defined by them providing
a ‘good’ or ‘excellent’ overall health rating
or, for AoU, providing
a rating of ‘Excellent’, ‘Very Good’, or ‘Good’
to survey questions on physical & mental health. That could result in loci relating to morbidity in a broader sense becoming salient; I note a locus associated with ETV5 (which in turn was previously linked to adiposity), was found. I wonder if the authors considered performing a sensitivity analysis with controls lacking in specific ME/CFS associated markers but not otherwise selected for >= good health?

For rs76847656, I wonder why the discussion didn't touch on the nearest gene, SBK1? Emphasising TUFM's eQTL & immune-related biology is understandable, although I notice that SBK1 appeared in a small NK expression paper from 2016:

Dysregulation of Protein Kinase Gene Expression in NK Cells from Chronic Fatigue Syndrome/Myalgic Encephalomyelitis Patients
 
Last edited:
I noticed that in 174 out of the 176 significant variants in supplementary spreadsheet S1, the minor allele is protective against ME/CFS (lower minor allele frequency in ME/CFS). Maybe the consistency is an indication of a batch effect.
 
the control cohort wasn't merely defined by an absence of ME/CFS associated signals; it was also defined by them providing "a ‘good’ or ‘excellent’ overall health rating"
I was wondering about this too because the goal is to compare ME/CFS cases agains the rest of the population, not necessarily those with good or excellent health. So it could have caused an additional selection bias.

I assume it was to make sure that none of the controls accidentally had ME/CFS for example undiagnosed cases or people who forgot to mention CFS in the interview. But given how uncommon ME/CFS already is, those cases would have formed only a very small percentage of the control group and would likely have little influence on the results.

On the other hand requiring controls to have good or excellent overall health might have changed and shifted the control population in all sorts of ways (e.g higher educated, richer, less bad luck in life, more optimistic, etc), that didn't occur in the ME/CFS population. The result may be that DNA difference not only reflect ME/CFS but those other differences as well.
 
Back
Top Bottom