Just posting some interesting stuff I'm learning.
Over here I'm working on testing correlations between ME/CFS severity and every lab test they did to see what's most correlated:
Amazingly, two participants are still tied. They had the same PEM and SF-36 scores (not all SF-36 domains were identical, but they happened to add up to the same number). I don't know if I'll just let them be tied or try to think of another tiebreaker.
The severity metric I'm planning to use has a tie, so I was curious if the correlation function I was planning to use, Spearman rho, is okay with ties. Ties meaning multiple participants have the exact same value for one or both variables. e.g. two participants have a severity of 5. And I remembered that of the ~3000 lab tests and survey questions, there are many, many ties, especially with surveys.
Multiple sources,
like this one, say Kendall's tau is more robust to ties:
Kendall’s tau is said to be a better alternative to Spearman’s rho under the conditions of tied ranks.
So I'm learning a bit about Kendall's tau.
Kendall uses a different method for measuring correlation of ordered data. (Like Spearman, it is a non-parametric test, so only order of points matters, not actual values.)
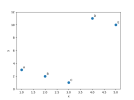
Using this data as an example:
A (1, 3)
B (2, 2)
C (3, 1)
D (4, 11)
E (5, 10)

Kendall's tau (τ) looks at every pair of points, so A and B, A and C, A and D, B and C, B and D, etc. And it checks if the pairs are concordant or discordant. Concordant means as x increases, y also increases. Discordant means as x increases, y decreases.
So A and B would be a discordant pair because x increased but y decreased. Basically a line slanting down between the two points. A and C would also be a discordant pair. A and D would be a concordant pair because both x and y increase.
So Kendall counts how many concordant and discordant pairs there are between all pairs of points. In this case there are 6 concordant pairs (AD, AE, BD, BE, CD, CE) and 4 discordant pairs (AB, AC, BC, DE).
Then it does a simple equation (C and D stand for number of concordant and discordant pairs):
(C-D)/(C+D) = (6-4)/(6+4) = 0.2
It returns a result between -1 and 1, with 1 being perfectly positively correlated (y always increases as x increases) and vice versa.
So 0.2 is the correlation coefficient. It has a small positive correlation.
Another way to picture it is by looking at all lines that connect every pair of points, like the following where positively sloped lines are green and negative are red. (I slightly moved a couple points so the lines wouldn't overlap.)

There are more green lines than red lines so the correlation is positive.
I think the equation might be slightly more complicated if there are ties.
The calculation for the p value is more complicated and I'm not sure of the details.
-----
One interesting illustration for the different results from Spearman and Kendall for the following data (example borrowed from a
Reddit comment):

Kendall's tau is negative: -0.12
Spearman's rho is positive: 0.2
Here's that green/red line way of visualizing it, although there's too many to easily see how many there are more of from a glance, but we know it's red from tau being negative. (Again moved points a bit to prevent line overlap, which doesn't affect tau.)

Or here's some real data. I found a
random dataset for diabetes patients. The plot of bmi vs HbA1c for only 16 random people with unique values, since I don't really know how it handles ties yet:

With the lines:

It does look like more green than red. And that matches the result of running the test. Tau=0.35, p=0.06. The higher the BMI, the higher the HbA1C.
And out of curiousity, I looked at the entire dataset of 100,000 people:

Doing the test, there is a very small positive correlation of tau = 0.045, p=2.3x10^-89.
For spearman it's rho = 0.06, p=1.7x10^-89, so pretty close.
Check out those p values. Wouldn't it be cool if every study we looked at on ME/CFS had 100,000 participants?


