Can someone help me out with confidence intervals? I'm trying to wrap my head around them but it’s not clicking. I get p-values fine, but the actual math and the 'why' behind CIs is a total mess for me. How do people actually use them in the real world? Thanks for any tips.
- Home
- Forums
- Discussion topics
- Research quality and methodology discussions
- Trial design including bias, placebo effect
You are using an out of date browser. It may not display this or other websites correctly.
You should upgrade or use an alternative browser.
You should upgrade or use an alternative browser.
Confidence intervals
- Thread starter Cripkult
- Start date
-
- Tags
- statistics
There should be a copy of " statistics for dummies " accessible on forum resources . I found a pdf of it some years ago and found it useful and forwarded a copy to be uploaded / linked.Can someone help me out with confidence intervals? I'm trying to wrap my head around them but it’s not clicking. I get p-values fine, but the actual math and the 'why' behind CIs is a total mess for me. How do people actually use them in the real world? Thanks for any tips.
Its a measure of how the thing you are measuring ( sample) is representative of the population it relates to - so confidence relates to the amount of reliability of the sample .
I don't however know how to access the resources section , so tagging @Hutan
The links below also describes what they are and how they work
Confidence Intervals
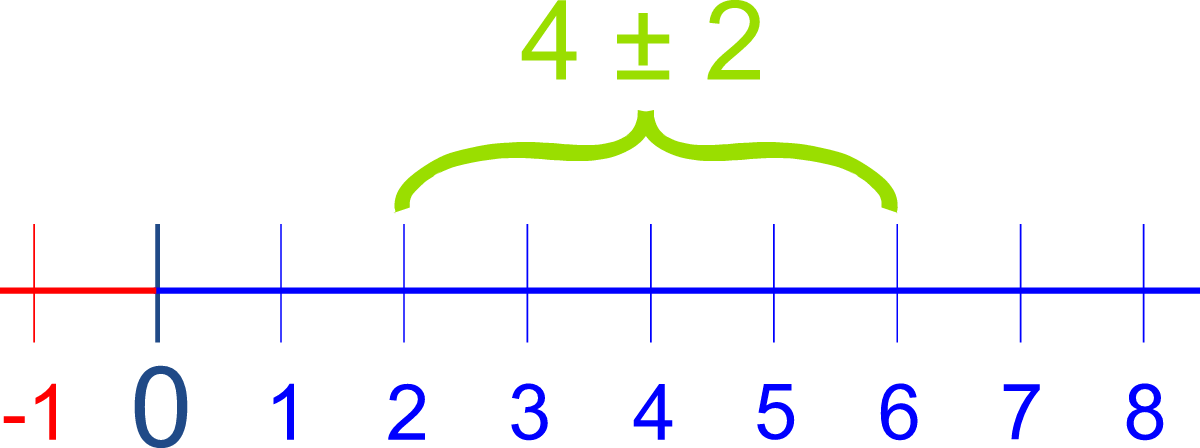
An interval of 4 plus or minus 2. A Confidence Interval is a range of values we are fairly sure our true value lies in.
www.mathsisfun.com
Chandelier
Senior Member (Voting Rights)
I find the study mode of ChatGPT to be very useful for math study related questions.Can someone help me out with confidence intervals?
It has interactive exercises and is pretty fun.
Jonathan Edwards
Senior Member (Voting Rights)
Even judging the merit of a <0.05 p value is an arbitrary thing, and confidence intervals assume that this is a magic cut off, which it isn't, but I find them useful as a rough guide to 'what the difference might actually be'.
So if the standard quantity for a population is 1.0 units
and for the test group is 1.7 units with CI 1.55-1.85
then you can see that not only is this a pretty reliable difference but you are confident it is pretty close to the result of 1.7
If the standard is 1.0 and the test level is 1.7 with CI 0.8-6.5 units you can see that you can neither be sure this is a real result (because if the CI overlap p must be more than 0.05) nor that you have any clear idea what the real difference is. It might be 1.5 or it might be 5.1, or whatever.
In a way it does not tell you anything more than p but for a group of results it can give a rough idea to what extent the results fit with a plausible explanation in the populations you are looking at in terms of the likely size of the difference. It tells you a bit more than p because it includes a measure of how much bigger the difference might actually be.
ME/CFS Science Blog
Senior Member (Voting Rights)
They give an indication of the sampling variance of your estimate if you repeated the experiment multiple times.Can someone help me out with confidence intervals? I'm trying to wrap my head around them but it’s not clicking. I get p-values fine, but the actual math and the 'why' behind CIs is a total mess for me. How do people actually use them in the real world? Thanks for any tips.
Suppose you test 20 ME/CFS patients and find that their mean fatigue score is 10 points. But the 20 ME/CFS patients you've chosen might not be representative of the entire ME/CFS population. So if you take a different 20 patients, you might get a different estimate like 8 points. If you repeated that experiment over and over again, you would get a distribution of estimates. It might show that most of them lie between 6.5 and 13.5 points.
In real life it's not feasible to repeat experiments over and over again, so researchers estimate this sampling variance (what if I'd taken 20 other patients?) mathematically. They estimate how much variance there is in the means by using the variance of scores in the sample of 20 ME/CFS patients they do have.
They'll assume that those (imagined) mean fatigue scores are normally distributed (means often are with large samples size even if the individual scores aren't) and that their standard variation is equal to the standard variation of the sample divided by the square root of the sample size. For example if the standard deviation in your sample was 8, then the standard deviation of the hypothetical means would be 8/ sqrt(20) or 1.78.
So that gives an overview of that hypothetical distribution of means if the experiment was repeated over and over again. Researchers assume that their estimate is the best guess for the true mean, so in this case 10 points. But they know that if they'd taken 20 other patients they might had a different result. So the final result of their experiment is not just 10 points, but a confidence interval around it. So they take approximately 2 standard deviations from that estimate to get 95% of the hypothetical distribution of the means. So the 95% confidence interval would go from 10-2*1.78 to 10+2*1.78. Those results might look like this: "we found a mean fatigue score of 10 points [95% CI: 6.44 - 13.56] in ME/CFS patients..."
The tricky thing is that this doesn't mean we're 95% confident that the estimate lies between 6.44 - 13.56 (that would require a different approach using Bayesian credible interval), it just estimates what would happen if the experiment was repeated multiple times. So the correct interpretation is that if you stick to this method of calculating the 95% confidence intervals, then in 95% of the experiments you do, the true estimate will lie within the confidence interval. It doesn't mean it's 95% sure it lies in the confidence interval of your one experiment. You might be in one of the red confidence intervals as show in the graph below.

Found Daniel Lakens course on statistics quite useful because it focuses on common misundesrtandings. Here's the chapter on Confidence intervals:
7 Confidence Intervals – Improving Your Statistical Inferences
This open educational resource contains information to improve statistical inferences, design better experiments, and report scientific research more transparently.
 lakens.github.io
Last edited:
Here's a link to the Resources section. I see there is a thread called 'Understanding Statistics there.I don't however know how to access the resources section , so tagging @Hutan
If anyone wants to find a section of the forum, go up to the top menu bar and click on 'Forums'. The sections are listed like a table of contents.
One thing to watch out for in the real world is what the error bars around mean values on a chart actually are.
Sometimes they are 95% confidence interval. Sometimes they are standard deviation (in which case you can do that '2 standard deviations' approximation either side of the mean to get to roughly the 95% confidence intervals).
Sometimes they are the standard error (SE). I have found it is a fairly good rule of thumb that papers that use SE are trying to prove something that isn't really true. That might be unfair, but it has a pretty good strike rate. That's because the SE is a lot smaller than the standard deviation (SE= SD/(SQRT of the sample size)), and so they can visually make it seem that the treatment and control or patient and control populations are more distinct than they probably are.
Another resource that helped me understand: The Intuition Behind Confidence Intervals