I have just been looking at my fitbit heart rate graphs and summary data for each day for the last week or so.
Steps are non dominant wrist movements
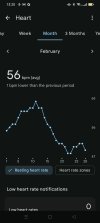
It tells me for each day: resting HR, lowest and highest HR,
and time spent in different heart rate zones: light up to 88, moderate 89 to 98, vigorous 99 to 109 and peak HR over 110 zones in minutes.
The zones are set by Fitbit according to my cardiovascular fitness and age,
My ME/CFS is severe, I'm housebound and spend most of the day nearly horizontal but on good days can manage to assemble simple meals and shower about once a week. One of the activities that takes me momentarily into the peak zone is struggling to pull off a rather tight sweater.
A couple of example days:
Yesterday: Steps: 1011
RHR 69, range 60-99, Peak 0 min, vigorous 0 min, moderate 49 min
Monday: Steps 932
RHR 68, range 58-107, Peak 0 min, vigorous 4min, moderate 44 min
Sunday: steps 975
RHR: 68, range 60-106, Peak 0 min, vigorous 11 min, moderate 66 min
My suggestion would be to use time spent each day in the exercise HR zones for each individual, as calculated by Fitbit and the step count.
So if I recovered and was able to do normal activities for my age, I would presumbably spend a lot more time each day in the more energetic HR zones, as well as my steps increasing significantly.
The advantage over just using steps would be taking into account HR increases when doing activities that don't involve steps, such as talking and stressful cognitive activities.
I haven't kept clear records of this data and correlated it with symptoms or time upright or PEM. Maybe I'll give it a try.