Hi Woolie, great to see you again - though I may have missed you previously.
That's true - here's one at the top of the tree on Google
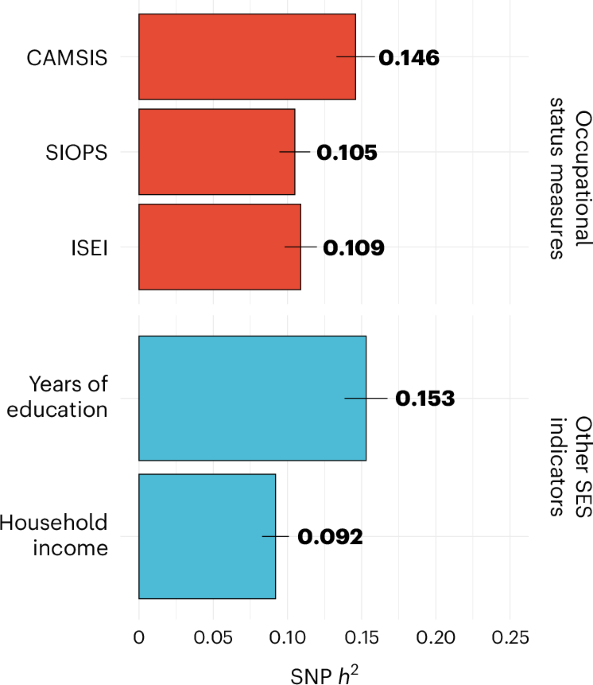
This genome-wide association study of occupational status in UK Biobank identified 106 genetic variants. Results highlight the role of family environment, childhood educational and occupational aspirations, and links to health.

www.nature.com
At the same time, research studies are always strongly skewed to higher SES, amongst many things. Yet for 15 years, GWAS have been finding biological differences linked to disease that either explain symptoms or chime with existing known mechanisms. The question is, are the differences that could be attributed to ME/CFS strong enough to explain anything like 8 loci and p< 5 x 10^-8?
I don't know if the team looked at things like SES - but it should be easy to do. I don't know if anyone here can look at e.g. known SES loci/genes vs ME/CFS?
(There seems to be no limit to what some people here can do, it is so impressive. I can't help wondering if any other part of the ME/CFS research community is making as much use of the data, though Chris did say in the webinar that there have been 42 downloads of the summary stats.)
DecodeME restricted the initial analysis to those with European ancestry, and within that spent a lot of effort controlling population ancestry, which can create such effects (immune ones are the strongest, esp on HLA genes, as particular common variants have proved protective or risky for historical pandemics). It helps that UK Biobanks is so big, making it much easier to find controls well matched by ancestry. So such an effect is unlikely. I think
@ME/CFS Science Blog also posted a graph showing minimal such effects on more common variants, though higher for less common ones, though they said the more common ones were more prominent in the findings.