Researcher Interactions Question collection thread for S4ME Q&A with Dr Karl Morten, University of Oxford, Sept 2019

Does anyone understand what this graph shows? It has always puzzled me.
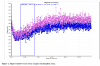
@Jonathan Edwards I'm not able to rewatch right now to see if this answers some of your questions, but these are the time-points where he explains the graph (from brief notes I took when first watching)

First discussed at timepoint 31:18 to 35:30


And then in the Q&A is some clarification of the experiment at the 1:07:00 timepoint.
 
karlmortenplasmaswap-jpg.8061


Does anyone understand what this graph shows? It has always puzzled me.

Where do the readings start? Are they all at 13 or higher or where? The first red reading is way lower than the other two. What is happening when the level dips. Was the plasma added at 0? If so why do the cells only go down as well if nothing has been added to them? What is the box between 1 and 2? Are the rows of dots just from a single sample each or are there lots of samples shown? Why are the data shown as dots rather than lines? Maybe Karl knows all the answers.

Firstly the red dots are the results from a plasma sample, from someone with ME, added to healthy muscle cells. The key thing is that the cells are consuming oxygen more quickly but are not necessarily producing energy efficiently (check out @wigglethemouse post/links to sections of the talk - Karl considers "efficient" energy production in ME or rather likely inefficient).

The cells treated with control plasma (healthy individual - blue dots) show normal oxygen consumption - lower oxygen consumption than ME plasma.

Cells only - I assume this is just cells without any plasma - oxygen consumption is the same as control plasma.

The extreme left hand side of the horizontal axis is the point the plasma is added/measurements begin.

I think you also need to consider Bhupresh Prusty's results (NIH Conference April 2019) he found reversible mitochondrial fragmentation (add ME plasma -- mitochondria fragment --- add healthy plasma mitochondria return to normal shape), Ron Davis's results (nano-needle) and Fluge and Mella's results (2016? publication - blockage in glucose metabolism - Karl discusses this in the clips from his presentation). All show some similar (reversible) changes [morphology (shape of mitochondria) in Bhupresh's case; energy production in Ron's/Fluge and Mella's case]. Karl looks at some possible causes microRNA's (in exosomes?) etc. (clips from his presentation - links posted by Wigglethemouse).

Sorry for the rushed reply.
 
Last edited:
That is what it seems like but if so why do the cells that have had nothing added suddenly take a dive in oxygen (due to nothing)?
Good question for Karl. He does go into the test in a little more detail in the report posted recently by the ME Association

It is hoped that the comments below and the report from Dr Morten’s team which explains in more detail what the study was all about and what its’ main findings were, will help address some of the questions still being asked.
From the linked document (double Dutch to me)
1.4 Oxygen Consumption Assay
Prepare cells as outlined earlier, count and adjust density to 1 X 10⁷/ml. Add 50μl to each well (500,000 cells/well). Add inhibitors as required and 15μl MitoXpress probe. Add sufficient RPMI-1640 to each well so that the final volume is 150ul. Cover with MitoXpress HS oil and read TRF overnight in a BMG plate reader Excitation TR-exl, Emission TR em2 with integration times of 30 and 70μs. An example trace of this output is depicted in Figure 2. Lifetime (μs/hr) on the y-axis shows the oxygen being consumed i.e. increasing over time (x-axis). Calculating the slope of this curve allows the rate of oxygen consumption to be determined.
The curve plotted in that report is an example of oxygen consumption rate and is very noisy compared to the one in this thread. I wonder if the initial dip is the effect of the added inhibitor (or one of the other thingy's mentioned)
upload_2019-8-27_13-50-3.png
 

Attachments

  • upload_2019-8-27_13-48-42.png
    upload_2019-8-27_13-48-42.png
    136.1 KB · Views: 2
Good question for Karl. He does go into the test in a little more detail in the report posted recently by the ME Association


From the linked document (double Dutch to me)

The curve plotted in that report is an example of oxygen consumption rate and is very noisy compared to the one in this thread. I wonder if the initial dip is the effect of the added inhibitor (or one of the other thingy's mentioned)
View attachment 8224
What is the inhibitor ( and is it left in solution overnight and if so what effect does this have over a prolonged timescale. - seems like a long time for someone with not much specific scientific knowledge)
 
That is what it seems like but if so why do the cells that have had nothing added suddenly take a dive in oxygen (due to nothing)?

I assume that @wigglethemouse has provided the answer i.e. you add inhibitors and then commence the measurements. Presumably it takes a short period of time before the system stabilises. I'm not terribly concerned to see; however, the answer may be interesting - if I can understand it!

One of Karl's comments, I think I recall, is that the effect of ME plasma (increasing oxygen consumption) persists for 24 hours -- this possibly strengthens the argument that the immediate change, after the start of the experiment, isn't important.

This is all presumably quite complex; we are after all dealing with the assessment of cellular energy production -- that's why we're lucky to have Karl's expertise. Maybe shouldn't mention it, but it appears that the Myhill group didn't manage to deliver a reliable test - that complexity may have been part of the problem!
 
Good question for Karl. He does go into the test in a little more detail in the report posted recently by the ME Association


From the linked document (double Dutch to me)

The curve plotted in that report is an example of oxygen consumption rate and is very noisy compared to the one in this thread. I wonder if the initial dip is the effect of the added inhibitor (or one of the other thingy's mentioned)
View attachment 8224

@Andy @wigglethemouse may have provided an answer to the question - i.e. can the assessment of oxygen consumption be used as a diagnostic test? I.e. no since the baseline is too noisy (data above shows a wide range in the measured values) - possibly Karl's slide in the presentation shows smoothed (averaged data).

Not sure if I fully understand my post -- so let's see what Karl's answer is!
 
From the video it sounds as if the initial dive is due to shifting the ambient oxygen from 22% to 8%. So maybe the only thing that matters is that the red line is lower than the other two for the duration.

Yes i.e. I think I recall that normal oxygen concentration for muscle cells is 8% and ambient (air) is 22% - so presumably they "incubate" at 8% oxygen for the experiment.

Also, the key point is that the healthy muscle cells, with ME plasma, are consuming more oxygen --- "red line is lower than the other two for the duration".

Just wondering if the signalling compound could be explained by something like this http://med.stanford.edu/news/all-ne...rns-out-thousands-of-tiny-novel-proteins.html
There's a thread on Phoenix re this,
 
Last edited:
Yes i.e. I think I recall that normal oxygen concentration for muscle cells is 8% and ambient (air) is 22% - so presumably they "incubate" at 8% oxygen for the experiment.

Also, the key point is that the healthy muscle cells, with ME plasma, are consuming more oxygen --- "red line is lower than the other two for the duration".

Just wondering if the signalling compound could be explained by something like this http://med.stanford.edu/news/all-ne...rns-out-thousands-of-tiny-novel-proteins.html
There's a thread on Phoenix re this,

@Andy @Jonathan Edwards I watched Maureen Hanson's presentation today - i.e. presentation at the Invest in ME Conference (May 2019 - http://www.investinme.org/IIMEC14.shtml).
If I picked it up correctly, they are finding larger numbers of exosomes i.e. in the plasma of people with ME compared to healthy people. So possibly this signalling, causing a change in cellular energy production, is caused by something in exosomes [micro-RNAs, protein--]. The material re exosomes is from 14 minutes to the end -- 8 minutes ish.

@Andy Check out Karl Johan Tronstad's presentation at the Invest in ME Conference (May 2019 - http://www.investinme.org/IIMEC14.shtml). From about 11 minutes on he discusses dis-regulation of pyruvate dehydrogenase i.e. glucose cannot be used in the citric acid cycle for energy production - normal source of energy. So the body uses compensation mechanisms, such as using certain amino acids (and fatty acids) for cellular energy production - e.g. the amino acids which bypass the blockage at the pyruvate dehydrogenase.

Possibly Hanson's group should be looking for micro-RNAs (in exosomes) which down-regulate pyruvate dehydrogenase - but that's possibly way too simple.

There's a slide at 13.21 minutes which shows the studies which found evidence of this change in energy production (switch to using amino acids, and fatty acids, rather than glucose) - 5 different authors and 7 different studies.

You could possibly ask Karl for his views on this data and what the signalling mechanism might be.

Complex stuff!
 
Back
Top Bottom