Using HRV to Characterise PEM

Kiristar

Senior Member (Voting Rights)
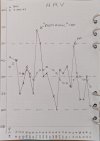
I am finding that my overnight average HRV scores on both my Garmin (and prior Polar) watches follow the same pattern - first a clear short peak then a deep prolonged trough, especially in more significant PEMs.

I wondered if anyone else has observed this in their data, and what it might indicate around the causes and nature of PEM?

In the below chart you can clearly see these weird hrv spikes which come before a prolonged trough...
PXL_20250611_074934489.jpg
 
I can't say I've noticed such a trend. I am severe so that might play into it. I'm not really sure what to make of HRV variantion.

For seven day average I like to use a spreadsheet calculation that covers 3 days before, today, 3 days in future. That way the 7 day average is aligned to the data instead of being 3.5 days behind. The downside is that viewing of the the average HRV plot is 3 days previous to today.
 
Interestingly, the pattern you note about a spike before the crash is something a Dr mentioned to me as something she had started to observe in the pre-PEM/PEM phases of people with ME and LC. Not sure what the answer is, but, I see it too to an extent - trouble for me is I just seem to be in rolling PEM, so is more about severity of PEM than no PEM. But, looking at yesterday, my HRV was up quite noticeably and then I had a horrific night, hardly slept and crashing way worse today.
 
Back
Top Bottom