Yes, on Google Trends, you can pick Metro or City for the subregion option.
Metro does make it more fine-grained into 210 areas, but the problem is that it becomes a lot harder to try to correlate it with other variables, since I think it'd be hard to find various stats like average income or ancestry subdivided in this way.
There's also the City option, but it looks like only 10 cities in the US have enough data to show.
If British ancestry were a risk factor for ME/CFS, then presumably we'd see a larger prevalence in Canada. I don't know if we have any good studies on that.
But if we are considering the Google Trends data for the past 22 years, the search interest in Canada for ME/CFS is only barely higher than in the US (scores are 18 vs. 16), which seems to go against the idea of British propensity for ME/CFS.
One slightly frustrating thing about Google Trends is that the data does not appear to be consistent if downloaded on different days, even if representing the same time span and search term.
The 22 year data for ME/CFS I was using was downloaded on 2026-03-24, and represents the time span of 2004-01-01 to 2004-03-24. I re-downloaded the data for the same time span today, and it is not the same. Of course, I probably shouldn't have included the present date of March 24 within the range of the time span for the original download, as the day wasn't done yet, but the additional few hours shouldn't meaningfully change the results that represent 22 years of data.
Others have commented about the inconsistency elsewhere, with the explanation given that the Trends data is not based on all Google searches, but is instead based on a relatively small sample. On a different day, the search interest for a topic could have been recalculated with a different sample, changing the results.
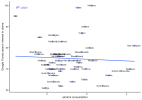
Thankfully, the values don't change by a huge amount. Here I have plotted the data I used for the previous analyses based on the 22 years of ME/CFS trends data, against the data I have re-downloaded today based on the same time span.
It's highly correlated, so shouldn't change results too much, but I wanted to note this to avoid confusion in case anyone follows the links to the Trends data I provided and sees that what it shows doesn't exactly match what I described in my posts.
Moving right along in our data mining operation...
CDC Wonder is a website which provides access to several interesting public health datasets. I downloaded age-standardized rates of causes of death grouped by state from the Multiple Cause of Death 1999 - 2020 dataset.
This dataset gives the rate of a cause of death in a state whether it was the single "underlying" cause of death, or if it was one of up to 20 additional contributing causes of death listed on the death certificate.
After filtering to only causes which all states had data for, I was left with 598 causes.
I tested Spearman correlation between each cause of death and the Google Trends ME/CFS data (using the same dataset I was using previously: 2004/01/01-2026/03/24), both with and without covariates added for potential confounders.
I added a few more covariates for this analysis that I didn't use previously: proportion of state that has never smoked, sex distribution, healthcare access (proportion who have been to the doctor in the past year) and age. Sources for all covariates:
Sex ratio
DP05, Estimate!!SEX AND AGE!!Total population!!Sex ratio (males per 100 females)
Age
DP05, Estimate!!SEX AND AGE!!Total population!!Median age (years)
Education
DP02, Percent!!EDUCATIONAL ATTAINMENT!!Population 25 years and over!!Bachelor's degree or higher
Internet access
DP02, Percent!!COMPUTERS AND INTERNET USE!!Total households!!With a broadband Internet subscription
Language spoken at home
DP02, Percent!!LANGUAGE SPOKEN AT HOME!!Population 5 years and over!!English only
Income
S1903, Estimate!!Median income (dollars)!!HOUSEHOLD INCOME BY RACE AND HISPANIC OR LATINO ORIGIN OF HOUSEHOLDER!!Households
Rurality
P2, proportion calculated from (!!Total:!!Rural)/(!!Total: )
Healthcare access
BRFSS, About how long has it been since you last visited a doctor for a routine checkup? Within the past year
These are the 15 most significant Spearman correlations for cause of death vs. ME/CFS searches in a state, ranked by p-value controlling for covariates:
Cause of death
Spearman R (Univariate)
P value (Univariate)
Spearman R (with covariates)
P value (with covariates)
Spearman P value (with covariates, Bonferroni)
Spearman P value (with covariates, FDR)
1
Muscular dystrophy (G71.0)
0.534
5.4E-05
0.606
2.1E-05
0.0125
0.0125
2
Alcohol, unspecified (T51.9)
0.508
1.4E-04
0.579
5.9E-05
0.0352
0.0176
3
Poisoning by and exposure to other and unspecified drugs, medicaments and biological substances, undetermined intent (Y14)
0.387
5.0E-03
0.558
1.2E-04
0.0735
0.0245
4
Perforation of intestine (nontraumatic) (K63.1)
0.496
2.1E-04
0.521
4.0E-04
0.2397
0.0599
5
Rheumatic heart disease, unspecified (I09.9)
0.513
1.2E-04
0.496
8.3E-04
0.4938
0.0854
6
Malignant melanoma of skin, unspecified - Malignant neoplasms (C43.9)
0.616
1.5E-06
0.495
8.6E-04
0.5123
0.0854
7
Other and unspecified narcotics (T40.6)
0.314
2.5E-02
0.488
1.0E-03
0.6181
0.0883
8
Crohn disease, unspecified (K50.9)
0.596
3.9E-06
0.479
1.3E-03
0.8000
0.1000
9
Vascular disorder of intestine, unspecified (K55.9)
0.400
3.6E-03
0.474
1.5E-03
0.9046
0.1005
10
Methadone (T40.3)
0.496
2.1E-04
0.467
1.8E-03
1
0.1084
11
Motor neuron disease (G12.2)
0.654
1.9E-07
0.463
2.0E-03
1
0.1084
12
Sequelae of complications of surgical and medical care, not elsewhere classified (T98.3)
0.437
1.4E-03
0.456
2.4E-03
1
0.1101
13
Acute vascular disorders of intestine (K55.0)
0.237
9.5E-02
0.456
2.4E-03
1
0.1101
14
Other synthetic narcotics (T40.4)
0.278
4.8E-02
0.448
3.0E-03
1
0.1190
15
Sequelae of surgical and medical procedures as the cause of abnormal reaction of the patient, or of later complication, without mention of misadventure at the time of the procedure (Y88.3)
0.408
2.9E-03
0.444
3.3E-03
1
0.1190
Only two causes were significant after strict Bonferroni correction with a 0.05 threshold: muscular dystrophy and alcohol. Poisoning was also below the 0.05 if correcting with FDR.
Alcohol is interesting because it aligns with the results of the previous analysis where we found high correlations with drugs meant for reducing alcohol cravings.
Here is a map showing rates for muscular dystrophy, which had the largest correlation. It doesn't show the distinct grouping of high values seen in both upper corners for both ME/CFS searches and British ancestry.
And a plot of ME/CFS search trends vs. muscular dystrophy rate (note the stats in the corner are univariate Pearson stats):
Edit: I attached a spreadsheet with correlation results for all causes.
Interesting to see losartan (and the other "sartans") in the negative correlation. I think they may have some effect in lowering or preventing increases in TGF-B? Which if I have understood correctly is one of the few somewhat consistent ME/CFS immune findings.
This almost certainly has nothing to do with losartan being "protective" against ME/CFS, and is possibly related to HBP being common in people with diabetes, which as noted earlier is more prevalent in the US South.
As a sensitivity check to see how much the changes in Google Trends data downloaded on different days would affect the correlations, I redid the above cause of death correlation analysis, but with the re-downloaded Google Trends ME/CFS data for the same time span (2004/01/01 - 2026/03/24).
These are, again, correlations of state search interest for ME/CFS with rates for state-wide cause of death.
There were some shifts in results, but it's still very similar. Muscular dystrophy became less significant, but death due to alcohol was still Bonferroni significant.
Cause of death
Spearman R (Univariate)
P value (Univariate)
Spearman R (with covariates)
P value (with covariates)
P value (with covariates, Bonferroni)
P value (with covariates, FDR)
1
Alcohol, unspecified (T51.9)
0.538
4.6E-05
0.607
2.0E-05
0.012
0.012
2
Sequelae of surgical and medical procedures as the cause of abnormal reaction of the patient, or of later complication, without mention of misadventure at the time of the procedure (Y88.3)
0.428
1.7E-03
0.535
2.6E-04
0.156
0.042
3
Sequelae of complications of surgical and medical care, not elsewhere classified (T98.3)
0.453
8.6E-04
0.535
2.6E-04
0.158
0.042
4
Rheumatic heart disease, unspecified (I09.9)
0.549
3.0E-05
0.533
2.8E-04
0.168
0.042
5
Muscular dystrophy (G71.0)
0.441
1.2E-03
0.522
3.9E-04
0.236
0.043
6
Intentional self-poisoning by and exposure to other and unspecified drugs, medicaments and biological substances (X64)
0.477
4.0E-04
0.514
5.0E-04
0.296
0.043
7
Vascular disorder of intestine, unspecified (K55.9)
0.394
4.2E-03
0.513
5.2E-04
0.309
0.043
8
Other and unspecified narcotics (T40.6)
0.375
6.7E-03
0.507
6.1E-04
0.364
0.043
9
Motor neuron disease (G12.2)
0.659
1.5E-07
0.501
7.2E-04
0.431
0.043
10
Other synthetic narcotics (T40.4)
0.329
1.8E-02
0.501
7.3E-04
0.434
0.043
11
Heroin (T40.1)
0.399
3.8E-03
0.497
8.0E-04
0.481
0.044
12
Methadone (T40.3)
0.509
1.3E-04
0.484
1.2E-03
0.704
0.056
13
Poisoning by and exposure to other and unspecified drugs, medicaments and biological substances, undetermined intent (Y14)
0.320
2.2E-02
0.482
1.2E-03
0.727
0.056
14
Embolism and thrombosis of unspecified vein (I82.9)
0.439
1.3E-03
0.462
2.1E-03
1
0.075
15
Crohn disease, unspecified (K50.9)
0.548
3.1E-05
0.462
2.1E-03
1
0.075
Edit: Also note that since these correlations are based on any of multiple causes from a death certificate, some of the different high correlations, such as "intentional self-poisoning" and "poisoning", could be largely describing the same deaths.
The data from that map is at this link. I did a quick linear regression with the trends data, without any covariates, and R^2 is 0.21. So still not really getting to the R2 of 0.35-0.5 we were getting with Scottish/English ancestry correlated with trends. But maybe there's something here. Maybe there's a better physical activity metric that would correlate better.
It could theoretically make sense. More physical activity could increase risk of someone with underlying risk of ME/CFS getting their first PEM.
This was with 2023 physical activity data using the variable "Percent of adults who achieve at least 150 minutes a week of moderate-intensity aerobic physical activity or 75 minutes a week of vigorous-intensity aerobic activity".
I also first tried the regression with 2015 data using a slightly different variable that doesn't include the vigorous activity part, and the result was pretty much the same with R2=0.22.
It occurs to me that the p-values I've reported for the correlations are probably not totally valid, since the observational units being tested here (states) are not really independent from each other. For example, states near each other will tend to be more similar to each other than to far away states for various metrics, which would skew p-values down.
But we can focus on the magnitude of the correlations to at least probe possible connections to ME/CFS searches.
That correlation with British ancestry is so interesting to me because it is remarkably high for being based on a hunch. I really want to see if it's possible to identify why they're correlated. Whether it's genetics, awareness, or something else, I feel like there should be some way to figure it out. My best idea at this point is testing correlations with lots of other variables to try to find something even more strongly correlated than ancestry.
Where are the best known ME/CFS and LC research groups, clinics and specialists?
Has someone already checked that? I've been following the thread from the start but can't remember.
I appreciate we might have to compile a list of people/institutions/businesses and corresponding locations first.
Where are the best known ME/CFS and LC research groups, clinics and specialists?
Has someone already checked that? I've been following the thread from the start but can't remember.
I appreciate we might have to compile a list of people/institutions/businesses and corresponding locations first.
This analysis is a good one, but it's also an idea I was trying to overcome at the very start.
It's easy to say Norway and the UK google me/cfs because they have higher awareness and more clinicians, and stop trying to untangle things there.
But we need to iterate our logic - awareness, researchers and clinicians may be more likely to spring up where prevalence is hgiher.
This is why I'm disinclined to definitively conclude Utah's high rate of me/cfs googling is due only to the location of the Bateman Horne centre. Like, yes, obviously the centre affects the results, but it's important not to stop the train of thought there.
I was actually wondering if it the centres, doctors and researchers were significantly contributing to the searches. So, if you have something like BHC, you have tens of employees who are googling ME/CFS stuff daily. They might be interested in e.g. cholesterol levels but to get better results would probably google "cholesterol ME/CFS" rather than just "cholesterol".
I was actually wondering if it the centres, doctors and researchers were significantly contributing to the searches. So, if you have something like BHC, you have tens of employees who are googling ME/CFS stuff daily. They might be interested in e.g. cholesterol levels but to get better results would probably google "cholesterol ME/CFS" rather than just "cholesterol".
Tested the hypothesis that perhaps liver damage might predispose a person to mecfs; noting the correlation with alcohol addiction medications seen by FG above.
But I found no correlaiton between 2023 alcohol consumption per capita and mecfs searches.
Is it too much of a stretch to think about the decodeME genetic regions? I know they’re not specific but are any of them correlated with diseases that are high among say, Northern European or British?
also how recent/strong would the Scots/English ancestry need to be? 3 generations? Six?
Tested the hypothesis that perhaps liver damage might predispose a person to mecfs; noting the correlation with alcohol addiction medications seen by FG above.
But I found no correlaiton between 2023 alcohol consumption per capita and mecfs searches.
That's surprising, since the correlation seemed large for both prescription of alcohol addiction drugs as well as deaths due to alcohol from a totally different source. Not only that, but I also ran correlations against around 2800 more variables from a third source, the Correlates of State Policy dataset, which I hadn't posted yet. And wouldn't you know it, an alcohol-related variable was number one.
First, looking at CDC Wonder for deaths data again, just to make sure I didn't mess anything up. This one's easier to check since it's just the raw data from the site, as opposed to the Medicare prescription data which I calculated using two variables.
I think maybe it didn't make sense for me to use the age-adjusted death rate, since we want the actual rate of deaths due to alcohol if we're comparing to the actual rate of Google searches. Anyway, the result seems about the same either way.
Here are the steps I used to get the crude rate per 100,000 for "T51.9 (Alcohol, unspecified)" as a "Multiple cause of death":
Change the values in the first section ("1. Organize table layout") under Group Results By to State for the first dropdown and Multiple Cause of Death for the second dropdown.
Check Age Adjusted Rate if you want that as well, but Crude rate should be fine, and this is provided by default.
In section 7 ("Select multiple cause of death"), use the tool to select "T51.9 (Alcohol, unspecified)" whether by using the Browse tab or the Search tab, then with it highlighted, click "Move Items Over".
In section 8 ("Other options")
Check "Export Results" to directly download the file, or uncheck to first see the data
Uncheck "Show Totals"
Set Precision to 9 decimal places.
Press Send.
And here is the plot of deaths due to alcohol vs. ME/CFS search interest:
It's a weird looking plot since it looks like it diverges into two lines, but there's a moderate relationship there with R2=0.16.
Ok, so now the third dataset I tested, Correlates of State Policy. I downloaded the 3000 variable dataset from this link, then ran this code to filter, for each variable, to the most recent year that had data for at least 45 states and at least 2 unique values. This resulted in 2795 variables.
Python:
from mecfs_trends.settings import DATA_PATH
import pandas as pd

df = pd.read_csv(DATA_PATH / "correlates_state_policy/raw/correlates.csv")
df = df.set_index("state")

cols = [c for c in df.columns if c not in ["st", "stateno", "state_fips", "state_icpsr", "year"]]

year_groups = {
    year: group[cols]
    for year, group in sorted(df.groupby("year"), reverse=True)
}

series_list = []
for col in cols:
    for year, year_df in year_groups.items():
        s = year_df[col]
        s = pd.to_numeric(s, errors="coerce")
        if s.notna().sum() >= 45 and s.nunique() >= 2:
            series_list.append(s.rename(f"{col}_{year}"))
            break

result = pd.concat(series_list, axis=1)
result.to_csv(DATA_PATH / "correlates_state_policy/cleaned/correlates_best_year.csv")
result
Here are the top 20 correlations based on Pearson, no covariates:
The names of the variables have to be looked up in their Codebook. The year after the variable name was added by me, indicating which year of the variable I used.
So the highest correlation is calcdist from 2015. In the codebook, the definition given is "Sum of 6 alcohol distribution variables = cbret + cbwhol + cwret + csret + cwwhol + cswhol". So this is a sum of these variables:
cbret: Exclusive state control of retail sales of some types of beer 0 = no, 0.5 = only some very high- alcohol beers (>12% ABV), 1 = yes, 5 = total prohibition; +1.5 = near- absolute on-premises prohibition, +0.5 = on-premises limitation (restaurants, bars, private clubs) Exclusive state control of wholesale sales of some types of beer
cwhol: Exclusive state control of wholesale sales of some types of beer 0 = no, 0.5 = only some very high- alcohol beers (>12% ABV/W), 1 = yes; +1.5 = near-absolute on-premises prohibition, +0.5 = on-premises limitation (restaurants, bars, private clubs)
cwret: Exclusive state control of retail sales of some types of wine 0 = no, 1 = yes; +1.5 = near-absolute on-premises prohibition, +0.5 = on- premises limitation (restaurants, bars, private clubs)
csret: Exclusive state control of retail sale of some types of spirits 0 = no, 1 = yes; +1.5 = near-absolute on-premises prohibition, +0.5 = on- premises limitation (restaurants, bars, private clubs)
cwwhol: Exclusive state control of wholesale sale of some types of wine 0 = no, 1 = yes; +1.5 = near-absolute on-premises prohibition, +0.5 = on- premises limitation (restaurants, bars, private clubs)
cswhol: Exclusive state control of wholesale sale of some types of spirits 0 = no, 1 = yes; +1.5 = near-absolute on-premises prohibition, +0.5 = on- premises limitation (restaurants, bars, private clubs)
I guess higher values mean more government control over alcohol sales, and the higher this is, the higher the searches for ME/CFS. I suppose if there are more deaths due to alcohol, there would be more government regulation. Here is the plot of that calcdist variable vs ME/CFS search interest:
The second highest is cwret, which is specifically government retail wine restrictions. And the third highest is ruse, which is defined as "Past month use of any illicit drug (percentages)", which also seems to be a similar topic to alcohol.
I'll see if I can find more datasets related to alcohol to test. Which one did you use for alcohol consumption @Murph? Maybe the variables I found to be correlated highlight more problematic alcohol use (needing treatment, dying, government regulation), while alcohol consumption per capita might include lots of non-problematic use.
Edit: Attached all results from Correlates of State Policy correlations.
Also, I think there is an issue with the variables that have "racep" in the name, from the CSP dataset. The definitions say they are about test scores for children of a given race, but the values seem strangely similar to the proportion of a state that is that race.
For example, r4_racep_white_perc is defined as: "This variable captures fourth grade reading scores among Whites at the state-year level."
Liver is a major immune-metabolic-endocrine organ and it could make sense that a compromised liver would make a person more prone to acquiring longlasting effects from an infection.
Certainly @mariovitali's AI analyses implicate the liver. And, n=1, my own student lifestyle immediately prior to coming down with me/cfs was not one of temperance, propriety and moderation. Rather the opposite. Furthermore, and at risk of drawing on steretotypes, a common thread between the scandinavians and the English might be a fondness for a drop. (although probably the germans drink too).
A counterpoint would be that mecfs hits adolescents, who are presumably not drinking and have no liver function risk factors.
I admit I was expecting a correlation when I set off to download that alcohol consumption data; perhpas that dataset is no good? Risk of double jeopardy though if you go looking for a different dataset every time you don't get the info you expect - we have to be driven by evidence in the end!
Is it too much of a stretch to think about the decodeME genetic regions? I know they’re not specific but are any of them correlated with diseases that are high among say, Northern European or British?
I was wondering about the genetics too. One way I was thinking of going about it was, if we assume the DecodeME regions cause ME/CFS, and if we assume being British increases risk of having ME/CFS, then we might expect that one or more of the DecodeME variants might be found more often in British people than people of other ancestries, as an explanation for the increased risk for people with British ancestry.
Here are the top DecodeME loci. The A1FREQ column shows the frequency of the variant in the cohort, so basically this is the frequency in British people.
I grabbed allele frequencies for other ancestries from the linked gnomAD pages for each of the 8 variants (sorted from most to least significantly associated with ME/CFS):
Effect for ME/CFS
United Kingdom Allele Frequency
(A1FREQ from DecodeME)
I chose two other ancestries to compare to, African since there seemed to be a negative correlation with African ancestry in earlier analyses which might suggest they have very low risk, and American since a high proportion of the US population reported this ancestry, but there was no correlation of American ancestry with ME/CFS searches.
So if the ancestry effect is due to one of these variants, we should expect that the frequency would be higher than in other ancestries for a variant that increases risk of ME/CFS, and lower for a variant that is protective.
I made the text green for the three variants that seem to follow this pattern. For example, the chr17 variant (near the CA10 gene) increases risk of ME/CFS and has a frequency of 33% in the UK, 24% in Americans, and 7% in Africans/African Americans.
There are also other ancestries to compare to in gnomAD, so this could use a deeper look (for the chr17 variant, only one other ancestry shows a higher frequency than that in DecodeME: Amish).
I don't think there's any smoking gun here, but maybe something to think about. CA10 seems to be one of the more robust findings from DecodeME, since the same variant is found to increase risk of chronic pain, so maybe it plays a big part in ME/CFS. And maybe this pattern of higher frequency in British ancestry combined with the British ancestry/Google searches correlation might further corroborate that.
Didn’t DecodeME only use people with European ancestry (or something like that)?
Too foggy to think it all through, but it feels like “group X” not being in the study might make interpreting “this variant is associated with ME/CFS and group X has it less often” more complicated.
One way I was thinking of going about it was, if we assume the DecodeME regions cause ME/CFS, and if we assume being British increases risk of having ME/CFS, then we might expect that one or more of the DecodeME variants might be found more often in British people than people of other ancestries, as an explanation for the increased risk for people with British ancestry.
That's unfortunately a bit too confounded by ancestry to begin with--it's a pretty common phenomenon that sets of associated variants or polygenic risk scores translate poorly across groups with different ancestry, even if they all have the same disease. You'll probably find that GWAS from different ancestry cohorts point to similar pathways overall, but each set of hits will be ancestry-specific to a degree because the respective risk variants will be interacting with a different frequency distribution of hundreds of other SNPs to produce the disease state.
So the hits from DecodeME should be interpreted as "variants associated with risk of developing ME/CFS among people with a British ancestry"
This site uses cookies to help personalise content, tailor your experience and to keep you logged in if you register.
By continuing to use this site, you are consenting to our use of cookies.