
You are using an out of date browser. It may not display this or other websites correctly.
You should upgrade or use an alternative browser.
You should upgrade or use an alternative browser.
Activity monitoring and patient-reported outcome measures in Myalgic Encephalomyelitis/Chronic Fatigue Syndrome patients, 2022, Rekeland et al
- Thread starter SNT Gatchaman
- Start date


Kalliope
Senior Member (Voting Rights)
The charity "Fokus på ME" has shared an update from the researchers about the Fitbit-study.
Oppdatering frå Haukeland om Fitbit-studien september 2022, på norsk:
google translation: Update from Haukeland on the Fitbit study September 2022...
quotes:
The purpose of this study was to investigate whether it is feasible and useful to use activity bracelets to monitor variations in activity in a clinical study, as well as to form an impression of natural variation in symptoms and activity level in a group of ME patients over time.
...
The article also describes that the level of activity and the patients' self-reporting fluctuates in many patients over time.
...
The Fitbit study does not say anything about the usual or average number of steps for ME patients; patients with mild ME disease were overrepresented in relation to severe disease, as we would like to see if we could capture greater and lesser variations in function. We also found that the accuracy of step measurement was variable.
Oppdatering frå Haukeland om Fitbit-studien september 2022, på norsk:
google translation: Update from Haukeland on the Fitbit study September 2022...
quotes:
The purpose of this study was to investigate whether it is feasible and useful to use activity bracelets to monitor variations in activity in a clinical study, as well as to form an impression of natural variation in symptoms and activity level in a group of ME patients over time.
...
The article also describes that the level of activity and the patients' self-reporting fluctuates in many patients over time.
...
The Fitbit study does not say anything about the usual or average number of steps for ME patients; patients with mild ME disease were overrepresented in relation to severe disease, as we would like to see if we could capture greater and lesser variations in function. We also found that the accuracy of step measurement was variable.
Last edited:

Ariel
Senior Member (Voting Rights)
There's also an entire page about severe ME. The information's definitely out there. We just need clinicians to be up to date.
I also think the severe ME page is a good development but it's just quite hard (imo) to navigate to. Is it just me? Maybe it would be possible for them to give it more prominence and make it more obvious it's there?
Tom Kindlon
Senior Member (Voting Rights)
I imagine this article in English from October 3 is similar:The charity "Fokus på ME" has shared an update from the researchers about the Fitbit-study.
Oppdatering frå Haukeland om Fitbit-studien september 2022, på norsk:
google translation: Update from Haukeland on the Fitbit study September 2022...
quotes:
The purpose of this study was to investigate whether it is feasible and useful to use activity bracelets to monitor variations in activity in a clinical study, as well as to form an impression of natural variation in symptoms and activity level in a group of ME patients over time.
...
The article also describes that the level of activity and the patients' self-reporting fluctuates in many patients over time.
...
The Fitbit study does not say anything about the usual or average number of steps for ME patients; patients with mild ME disease were overrepresented in relation to severe disease, as we would like to see if we could capture greater and lesser variations in function. We also found that the accuracy of step measurement was variable.
Karen Kirke
Senior Member (Voting Rights)
I have been meaning to post these figures I made years ago showing change in physical function scores and steps over 6 months without intervention in Rekeland et al's cohort.
These tangles helped me understand that lots of people's functioning jumps around a lot, while others' functioning, including my own, stays roughly the same.
Edit: NB The colours do not correspond between the two graphs. Excel randomly assigned the colours. So the purple person in the SF36PF graph will probably not be the purple person in the steps graph. See graphs for each individual in subsequent posts.
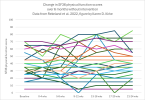

These tangles helped me understand that lots of people's functioning jumps around a lot, while others' functioning, including my own, stays roughly the same.
Edit: NB The colours do not correspond between the two graphs. Excel randomly assigned the colours. So the purple person in the SF36PF graph will probably not be the purple person in the steps graph. See graphs for each individual in subsequent posts.
Last edited:
Karen Kirke
Senior Member (Voting Rights)
Fixed Y-axis label on steps chart.

Ravn
Senior Member (Voting Rights)
These are great @Karen Kirke
Should be required reading for anyone planning an intervention study
Should be required reading for anyone planning an intervention study
Karen Kirke
Senior Member (Voting Rights)
Oh good, glad you like them. They certainly taught me a few lessons.These are great @Karen Kirke
Should be required reading for anyone planning an intervention study
The paper is an absolute treasure trove. Thanks are due to the people who did the study for gathering such useful data:
Ingrid G. Rekeland, Kari Sørland, Ove Bruland, Kristin Risa, Kine Alme, Olav Dahl, Karl J. Tronstad, Olav Mella, Øystein Fluge
Last edited:
Karen Kirke
Senior Member (Voting Rights)
I thought it might be more useful to see the graphs side by side. Here they are grouped into one. Not sure how well this will work on phones, we'll see.
Edit: NB The colours do not correspond between the two graphs. Excel randomly assigned the colours. So the purple person in the SF36PF graph will probably not be the purple person in the steps graph. See individual graphs in subsequent posts.

Edit: NB The colours do not correspond between the two graphs. Excel randomly assigned the colours. So the purple person in the SF36PF graph will probably not be the purple person in the steps graph. See individual graphs in subsequent posts.
Last edited:
Karen Kirke
Senior Member (Voting Rights)
For reference:
The range in change in steps for those whose SF36PF stayed the exact same was -1827 to +2637.
I think people often think that
(a) change in steps is going to be a much more accurate way of measuring response to interventions than SF36PF
(b) if someone's steps change by a lot, they have had a "real" response to an intervention
Rekeland et al.'s data challenges those assumptions.
- mean change in SF36PF for the 26 participants who had data at both baseline and 21-24 wks was +3.6 (range -20 to +45)
- mean change in steps from weeks 1-4 to weeks 21-24 was+547 (range -1827 to +6319)
The range in change in steps for those whose SF36PF stayed the exact same was -1827 to +2637.
I think people often think that
(a) change in steps is going to be a much more accurate way of measuring response to interventions than SF36PF
(b) if someone's steps change by a lot, they have had a "real" response to an intervention
Rekeland et al.'s data challenges those assumptions.
Last edited:

My step count over the years have varied between <1000/day and >15 000/day for weeks/months. I think one would need a lot of extra information than just step count to analyse what could be going on with someone.

Certainly some individual variation for a lot of patients.
But I am not so concerned about that. There are a number of possible or plausible explanations on the table:
It is not a surprising result. Patient reports have long indicated such variation is a common feature. Far as I know this is true for most chronic conditions.
The individual and group averages over time, including trend lines, are important info too.
The significant increase in mean steps in a non-intervention arm suggests that patients naturally learn by experience and practice to better manage and adapt, which is also not surprising. I would also expect that to be true for virtually all chronic medical conditions.
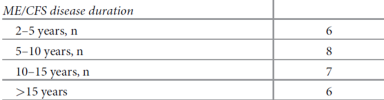
A 6 month sample period could influence that results, depending on the duration of illness. The shorter the duration, the more learning proportionally the patients would be undergoing. e.g. A patient sick for one year, v. one sick for 10 years.
What was the average duration of illness for this sample?
I am bit concerned about the extended flat line data for some patients on the SF36 measure. That could be a problem with protocol or data fidelity.
The discrepancies in results between the two measures for some patients might be interesting. Such as the medium orange patient, with a flat line SF36 score of 45, probably above the group average, but also one of the lowest mean steps scores. One problem with this might simply be how patients define physical function changes for themself over time, or inconsistently between patients. That is, the measure is not measuring the same thing for each patient at every sample point.
I think we need much greater statistical power, for any form of actigraphy. Important clues from activity patterns may well lie in the finer statistical detail. More patients, continuous sampling, for long periods (several months?).
But I am not so concerned about that. There are a number of possible or plausible explanations on the table:
It is not a surprising result. Patient reports have long indicated such variation is a common feature. Far as I know this is true for most chronic conditions.
The individual and group averages over time, including trend lines, are important info too.
The significant increase in mean steps in a non-intervention arm suggests that patients naturally learn by experience and practice to better manage and adapt, which is also not surprising. I would also expect that to be true for virtually all chronic medical conditions.
A 6 month sample period could influence that results, depending on the duration of illness. The shorter the duration, the more learning proportionally the patients would be undergoing. e.g. A patient sick for one year, v. one sick for 10 years.
What was the average duration of illness for this sample?
I am bit concerned about the extended flat line data for some patients on the SF36 measure. That could be a problem with protocol or data fidelity.
The discrepancies in results between the two measures for some patients might be interesting. Such as the medium orange patient, with a flat line SF36 score of 45, probably above the group average, but also one of the lowest mean steps scores. One problem with this might simply be how patients define physical function changes for themself over time, or inconsistently between patients. That is, the measure is not measuring the same thing for each patient at every sample point.
I think we need much greater statistical power, for any form of actigraphy. Important clues from activity patterns may well lie in the finer statistical detail. More patients, continuous sampling, for long periods (several months?).
Karen Kirke
Senior Member (Voting Rights)
Watch out – the colours do not match between the two graphs. They were chosen by Excel. I did not choose colours for each participant. Someone else might be able to do that. I’ve looked up that case that is orange in the PF graph. Both PF score and steps were constant. Steps changed by -20 from the first to last measurement period.The discrepancies in results between the two measures for some patients might be interesting. Such as the medium orange patient, with a flat line SF36 score of 45, probably above the group average, but also one of the lowest mean steps scores. One problem with this might simply be how patients define physical function changes for themself over time, or inconsistently between patients. That is, the measure is not measuring the same thing for each patient at every sample point.
But see next posts!
Karen Kirke
Senior Member (Voting Rights)
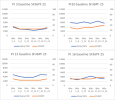
During a rest, I remembered I also graphed SF36PF and steps for each individual.
I've grouped them by baseline SF36PF. Starting with the mildest group:
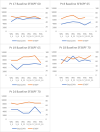
I've grouped them by baseline SF36PF. Starting with the mildest group:
Last edited:
Karen Kirke
Senior Member (Voting Rights)
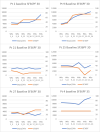
Here's the next batch, which we could think of as being in the upper half of moderate:

Last edited:
Karen Kirke
Senior Member (Voting Rights)
These would potentially be in the lower half of moderate, with some on the border with severe:

Last edited:
Karen Kirke
Senior Member (Voting Rights)
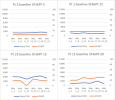
And the most severe:
Last edited:
Karen Kirke
Senior Member (Voting Rights)
From table 1 in Rekeland et al. 2022:What was the average duration of illness for this sample?
I think the fact that the study started in winter and ended in summer is probably playing a role. People who are able to go outside and walk are probably more likely to when it is warmer, drier and light for longer.
Here’s what Rekeland et al. themselves thought:
The cause of the increased activity during the study period is not certain. In a recent metaanalysis, feedback through activity monitors was found to increase the daily steps by 1235 in mixed groups of adults [34]. Such an effect could also be relevant for ME/CFS patients, yet with presumably smaller effect sizes due to the debilitating nature of their illness. Improvements in steps per 24 hours and in SF-36 PF scores (increase of 12 points) were also seen during two years follow-up in the placebo-group of the RituxME-trial [7]. We speculate that participation in a study with regular follow-up is in itself beneficial for the patients, and can explain some of the improvements during six months’ follow-up. If the improvements seen in this and other studies can indeed be ascribed to a care effect, this is an important take home message to health services; even if there are limited treatment options available, these patients require qualified and regular support from health care
professionals.
Huh. I just look at those people and think "My tribe!"I am bit concerned about the extended flat line data for some patients on the SF36 measure. That could be a problem with protocol or data fidelity.
You made me remember that I looked at just that! Hopefully you'll enjoy the individual graphs just posted.The discrepancies in results between the two measures for some patients might be interesting.
Last edited:
Karen Kirke
Senior Member (Voting Rights)

Mij
Senior Member (Voting Rights)
I think the fact that the study started in winter and ended in summer is probably playing a role. People who are able to go outside and walk are probably more likely to when it is warmer, drier and light for longer.
Many of us are heat intolerant. I'm out walking more often during the cooler/colder months.