Heart rate as a measure of ME/CFS-relevant exertion/severity

Completely anecdotally - I read an article I think in The New Yorker that made the claim that all mammals seem to have roughly the same average total number of heartbeats over their whole lifespan. So any being with a higher average heart rate would have a shorter overall life, lower average heart rate would have a longer overall life. And this seemed to apply between animals of the same species (e.g different humans) and between different animals... if that makes sense
 
I get a higher HR from being on S4ME on my phone while lying flat (with betablockers), than what my sister gets from walking at a fast pace for an hour.
Just double checking something if you want to share: are you saying the amount your HR increases versus resting is very high compared to a healthy person, or is it substantially higher all the time, and the increase from being on your phone is fairly minimal?

Edit: Either way, I think that is true, that when someone is more fit, exertion doesn't tend to increase their HR as much. Which would throw a wrench into my idea.
 
Last edited:
Just double checking something if you want to share: are you saying the amount your HR increases versus resting is very high compared to a healthy person, or is it substantially higher all the time, and the increase from being on your phone is fairly minimal?

Edit: Either way, I think that is true, that when someone is more fit, exertion doesn't tend to increase their HR as much. Which would throw a wrench into my idea.
My HR delta is substantially higher from exertion (including mental) compared to healthy.

My HR in general is also higher than I would have expected it to be, but I’m severely deconditioned so it’s not entirely unexpected.

I think the ration of HR to exertion would be interesting to look at, but then you run into the issue of tracking exertion.
 
I forgot to mention, btw. I think attempts to objectively measure the severity, exertion, and PEM is a worthwhile effort. We talk about the exertion and severity in subjective, qualitative terms; we don't know for sure if two different severities are comparable. Objective scalar values to describe them would greatly aid in both research and daily management of the disease.
 
Bought my Fitbit just as my remission was ending so didnt really get to see any useful data there. Almost 2 years ago now.

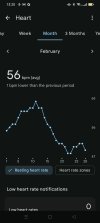
Ive finally had to bite the bullet and give up watching sports or following the news because my resting heart rate would increase so much and I could feel how this increase was correlated with stress. It was never the measured increase in HR during exertion that I found useful. But how my body simply wouldn't calm down after ''overexerting'' myself with a high resting HR.


Had to quit during the Winter Olympics which was a massive tragedy for me. Given how I am Scandinavian and a massive winter sports fan. You can pretty much see the point I quit here:
 

Attachments

  • Screenshot_2026-03-04-13-20-22-80_79fad72b192ad145911621ab74435811.jpg
    Screenshot_2026-03-04-13-20-22-80_79fad72b192ad145911621ab74435811.jpg
    106 KB · Views: 9
That picture is quite clear!!

:hug: :hug: :hug: :hug: for having to stay clear of watching your favorite sports.

Maybe for the same reason I took an interest in cricket an sumo wrestling, years ago.
I watch american news a lot, I'll check my heartrate doing that.
Seeing your results I think I already know the answer. News diet.
 
I have just been looking at my fitbit heart rate graphs and summary data for each day for the last week or so.
Steps are non dominant wrist movements
It tells me for each day: resting HR, lowest and highest HR,
and time spent in different heart rate zones: light up to 88, moderate 89 to 98, vigorous 99 to 109 and peak HR over 110 zones in minutes.
The zones are set by Fitbit according to my cardiovascular fitness and age,

My ME/CFS is severe, I'm housebound and spend most of the day nearly horizontal but on good days can manage to assemble simple meals and shower about once a week. One of the activities that takes me momentarily into the peak zone is struggling to pull off a rather tight sweater.

A couple of example days:
Yesterday: Steps: 1011
RHR 69, range 60-99, Peak 0 min, vigorous 0 min, moderate 49 min
Monday: Steps 932
RHR 68, range 58-107, Peak 0 min, vigorous 4min, moderate 44 min
Sunday: steps 975
RHR: 68, range 60-106, Peak 0 min, vigorous 11 min, moderate 66 min

My suggestion would be to use time spent each day in the exercise HR zones for each individual, as calculated by Fitbit and the step count.
So if I recovered and was able to do normal activities for my age, I would presumbably spend a lot more time each day in the more energetic HR zones, as well as my steps increasing significantly.
The advantage over just using steps would be taking into account HR increases when doing activities that don't involve steps, such as talking and stressful cognitive activities.

I haven't kept clear records of this data and correlated it with symptoms or time upright or PEM. Maybe I'll give it a try.
 

11 min read

What recovery pattern data can show about Post-Exertional Malaise​

This research note was prepared in response to requests from members of Welltory’s community of users with energy-limiting conditions. Following internal presentation of these findings, community members requested a shareable version that they could reference in their own conversations with healthcare providers, family, and other patient communities. We are publishing this as a contribution to open knowledge about post-exertional malaise and related conditions.

Jane Smorodnikova
Founder & CEO

Prof. Ancha Baranova
Systems biology expert in chronic diseases and aging

Anna Elitzur
Medical Advisor at Welltory


Implications for further research

The three physiological patterns identified here — recovery consistency, autonomic switching speed, and cardiac cost of movement — are derived from continuous heart rate data collected by consumer wearables. Several open questions remain for the research community:

Whether these patterns replicate in clinically confirmed cohorts, where diagnostic ground truth is available through validated instruments such as the DePaul Symptom Questionnaire or 2-day CPET.

Whether the activity confound described here explains a portion of the effect sizes reported in existing wearable-PEM literature. Studies that did not stratify by activity intensity may have measured fitness differences rather than PEM-specific patterns.

Whether the cascade effect — poor recovery predicting subsequent poor recovery — has clinical utility as a longitudinal monitoring signal, distinct from the cross-sectional patterns.

Whether menstrual cycle phase, which is known to affect autonomic function and recovery, acts as a modifier of these patterns.

Whether these patterns hold across a broader range of wearable devices and populations beyond the Welltory user base.
 
Last edited:
Back
Top Bottom