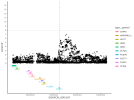
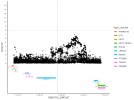
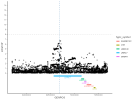
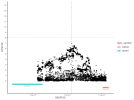
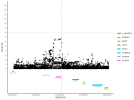
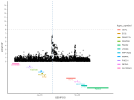
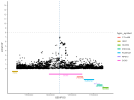
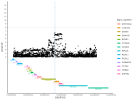
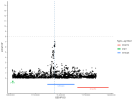
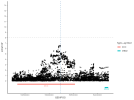
Location | Implicated genes | Also implicated in (selected examples, not the full list): |
Chromosome 1
173.50-174.70 | unclear | / |
Chromosome 6p
26.15-26.50 | BTN3A2 | Intelligence, sexual dimorphism, BMI, schizophrenia, Multiple myeloma, Major depressive disorder |
Chromosome 6q
97.60-99.00 | POU3F2 | socioeconomic status, intelligence, smoking initiation educational attainment, mathematical ability, morning person |
Chromosome 6q
97.60-99.00 | FBXL4 | cognitive function measurement, bone density socioeconomic status, major depressive disorder, educational attainment |
Chromosome 12
118.00-118.50 | PEBP1 | Wellbeing: positive affect, few results |
Chromosome 12
118.00-118.50 | SUDS3 | prostate specific antigen amount, VSIG10 protein levels, neuroticism, loneliness, depression, Alzheimer |
Chromosome 12
118.00-118.50 | ТАОКЗ | No results |
Chromosome 13
53.00-53.50 | OLFM4 | Insomnia, major depressive disorder, BMI, educational attainment |
Chromosome 15
54.60-55.40 | UNC13C | Severe COVID-19 infection, memory performance, age at menarche, educational attainment, breast cancer |
Chromosome 15
54.60-55.40 | RSL24D1 | BMI, Survival in coronary artery disease, educational attainment, breast cancer |
Chromosome 17
52.05-52.40 | CA10 | Insomnia, Smoking initiation, Height, menarche age at onset, pain, educational attainment, Bacterial meningitis |
Chromosome 20
48.80-49.60 | ARFGEF2 | Intelligence, body height, BMI, subjective well-being, Alzheimer |
Chromosome 20
48.80-49.60 | CSE1L | Intelligence, wellbeing, body fat, height, Alzheimer, loneliness |
Chromosome 20
48.80-49.60 | PREX1 | Intelligence, body height, blood pressure, colorectal cancer, multiple myeloma, |
Chromosome 20
48.80-49.60 | STAU1 | Intelligence, height, well-being, depressive symptoms, insomnia |
| | |
Chromosome 1
69.69 | LRRC7 | Educational attainment, bone density, BMI, adolescent idiopathic scoliosis, depression/anxiety |
Chromosome 1
73.12 | NEGR1 | Intelligence, insomnia, socioeconomic status, BMI, schizophrenia, ADHD, autism, depression |
Chromosome 1
73.12 | LRRIQ3 | Education attainment, Alzheimer, |
Chromosome 1
91.02 | ZNF64 | No results |
Chromosome 1
91.02 | BARHL2 | Smoking initiation, BMI, educational attainment, socio-economic status, body weight, morning chronotype |
Chromosome 6
43.36 | UNCLEAR | / |
Chromosome 12
12.39 | CCDC92 | BMI, body fat, coronary artery disease |
Chromosome 12
12.39 | DNAH10 | BMI, body fat, height, insomnia, atrial fibrillation |
Chromosome 17
11.32 | SHISA6 | Myopia, sleep duration, smoking initiation, short sleep duration |
Chromosome 18
53.23 | DCC | Intelligence, Gallbladder cancer, Insomnia, Schizophrenia, Chronic back pain, depression, |

