
You are using an out of date browser. It may not display this or other websites correctly.
You should upgrade or use an alternative browser.
You should upgrade or use an alternative browser.
Preprint Initial findings from the DecodeME genome-wide association study of myalgic encephalomyelitis/chronic fatigue syndrome, 2025, DecodeMe Collaboration


ME/CFS Science Blog
Senior Member (Voting Rights)
Coloc problem
I think there might be an issue with the colocalization analysis and Figure 4 in the DecodeME preprint. This is important because these results determined whether a candidate gene is considered Tier 1 or not. In brief, In think the paper used only the significant SNPs from the GTExv10 data to match it with DecodeME data while the coloc analysis probably requires the full dataset.
GTEx gives data on gene expression in 49 different tissues. It allows researchers to check if a certain DNA variant or SNP is associated with increased expression of a particular gene in each of the tissues. The preprint took the regions around the 8 DecodeME hits and looked for genes that have a significant association to a SNP in that same region in the GTEx dataset. The preprint then calculated if the GTEx gene expression signal matched the one found in DecodeME using an analysis called colocalization. But I suspect there is an issue here because it appears that the analysis only used SNPs that had reached the significance threshold in GTEx, rather than the full data.
Supplementary table 6 shows the datasets end in 'signif_pairs.parquet' which usually refers to this limited dataset and I was also able to largely replicate the coloc results in that table using the significant SNPs only retrieve using the GTEx API. The problem is that in several cases these are only a fraction of the SNPs that do not represent the data in this region.
Hopefully the plot below clarifies the problem. The gray dots are GTEx data* for SNPs that were also in DecodeME. The blue ones are the significant SNPs. The first graph shows that these were top results in our example namely the gene ARFGEF2 in visceral adipose tissue in the locus on chromosome 20. The second graph shows that these significant SNPs exclude the top SNPs in DecodeME. The preprint reports that these two signals 'colocalize' while this isn't actually the case if you use the full dataset.
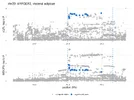
*One caveat is that I didn't' actually manage to get the full GTEx dataset (the GTExwebsite say it's on a Google Cloud bucket but the link looks broken). So I used eQTL Catalogue version of the GTEx data (they used the same raw data but analysed it using their own standardised pipeline).
My guess is that many of the reported associations in Figure 4 do not hold up and are an artifact of using only the significant SNPs in the coloc analysis. Here's my reasoning about this. Coloc has 5 possible outcomes:
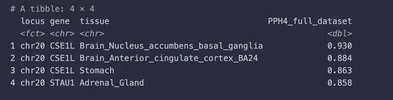
using the full (eQTL Catalog) dataset, I only found 4 eQTL associations in the chr20 locus (none involving ARFGEF2).
I think there might be an issue with the colocalization analysis and Figure 4 in the DecodeME preprint. This is important because these results determined whether a candidate gene is considered Tier 1 or not. In brief, In think the paper used only the significant SNPs from the GTExv10 data to match it with DecodeME data while the coloc analysis probably requires the full dataset.
GTEx gives data on gene expression in 49 different tissues. It allows researchers to check if a certain DNA variant or SNP is associated with increased expression of a particular gene in each of the tissues. The preprint took the regions around the 8 DecodeME hits and looked for genes that have a significant association to a SNP in that same region in the GTEx dataset. The preprint then calculated if the GTEx gene expression signal matched the one found in DecodeME using an analysis called colocalization. But I suspect there is an issue here because it appears that the analysis only used SNPs that had reached the significance threshold in GTEx, rather than the full data.
Supplementary table 6 shows the datasets end in 'signif_pairs.parquet' which usually refers to this limited dataset and I was also able to largely replicate the coloc results in that table using the significant SNPs only retrieve using the GTEx API. The problem is that in several cases these are only a fraction of the SNPs that do not represent the data in this region.
Hopefully the plot below clarifies the problem. The gray dots are GTEx data* for SNPs that were also in DecodeME. The blue ones are the significant SNPs. The first graph shows that these were top results in our example namely the gene ARFGEF2 in visceral adipose tissue in the locus on chromosome 20. The second graph shows that these significant SNPs exclude the top SNPs in DecodeME. The preprint reports that these two signals 'colocalize' while this isn't actually the case if you use the full dataset.
*One caveat is that I didn't' actually manage to get the full GTEx dataset (the GTExwebsite say it's on a Google Cloud bucket but the link looks broken). So I used eQTL Catalogue version of the GTEx data (they used the same raw data but analysed it using their own standardised pipeline).
My guess is that many of the reported associations in Figure 4 do not hold up and are an artifact of using only the significant SNPs in the coloc analysis. Here's my reasoning about this. Coloc has 5 possible outcomes:
- H0 Neither trait has a genetic association in the region.
- H1 Only trait 1 is associated with the region.
- H2 Only trait 2 is associated with the region.
- H3 Both traits are associated, but they are driven by independent, distinct causal variants.
- H4 Both traits are associated and share a single, common causal variant.
- For H3 the prior is n * 1e-4 * (n-1) * 1* 1e-4
- For H4 the prior is n * 1e-5.
using the full (eQTL Catalog) dataset, I only found 4 eQTL associations in the chr20 locus (none involving ARFGEF2).

mariovitali
Senior Member (Voting Rights)
I have a rare PER2 variant (one of the genes in the circadian rythm machinery) and early onset ME/CFS (maybe). In my case it seems to have all started with sudden, extremely unrefreshing sleep on some days (for 1 year), with no apparent link to anything.
Does the fact that a symptom was the first to manifest have a special meaning in other diseases? Maybe it is the part of physiology from which the dysfunction began spreading out to other parts?
Looking further at PER2 function, I found a study (in mice) where Peroxisome Proliferator Gamma is mentioned and also triacylglycerols (which we have come across before in ME/CFS). More specifically :
Furthermore, mutant mice showed a drastic decrease in plasma levels of total triacylglycerol (TAG) and nonesterified fatty acid (NEFA) (Figures 1E and 1F). These alterations could not be attributed to differences in food intake, as food consumption was identical in Per2−/− and WT mice (Figure 1G). When analyzed by indirect calorimetry, Per2−/− mice showed a significant increase in oxygen consumption as compared to WT (Figure 1H). These results demonstrate a pronounced alteration of lipid metabolism in mice lacking the Per2 gene.
Also, regarding PPARγ and PER2 , it appears that there is an association with dopamine neuron survival via NURR1
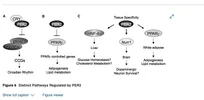
Link of study : https://www.cell.com/cell-metabolism/fulltext/S1550-4131(10)00357-8

I haven't independently checked any of that, but in case the analysis did only use significant SNPs, I just wanted to quote the coloc documentation which states that all SNPs should be used, as you say:Hopefully the plot below clarifies the problem. The gray dots are GTEx data* for SNPs that were also in DecodeME. The blue ones are the significant SNPs. The first graph shows that these were top results in our example namely the gene ARFGEF2 in visceral adipose tissue in the locus on chromosome 20. The second graph shows that these significant SNPs exclude the top SNPs in DecodeME. The preprint reports that these two signals 'colocalize' while this isn't actually the case if you use the full dataset.
Please do include all SNPs you have in the region: do not trim by significance or MAF or other means. Coloc enumerates all possible configureations of shared and non-shared causal variants and evaluates their relative support; it cannot do this if it does not have all the SNPs available.

I think there might be an issue with the colocalization analysis and Figure 4 in the DecodeME preprint.
What you say makes sense to me. Here's Figure 4 from the DecodeME Preprint with the chromosome 20 genes at the bottom of the column.
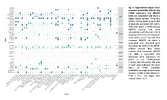
@Chris Ponting, could you or a team member respond to ME/CFS Science Blog's post about the SNP set used for the colocalisation analysis?

Chris Ponting
Senior Member (Voting Rights)
Thank you. Good spot: yes, we agree. The DecodeME project deprecated this analysis quite soon after the preprint was posted. This meant that we hadn't since gone back to double- (or triple-) check its findings. Rather, the team was working on a completely different Figure 4, using very different methods, to prioritise variants & genes. The new Figure 4 analysis needs access to the UK Biobank compute facility ("the RAP") so - as with all analyses - we're waiting for UK Biobank to reopen the RAP.Coloc problem
I think there might be an issue with the colocalization analysis and Figure 4 in the DecodeME preprint. This is important because these results determined whether a candidate gene is considered Tier 1 or not. In brief, In think the paper used only the significant SNPs from the GTExv10 data to match it with DecodeME data while the coloc analysis probably requires the full dataset.
GTEx gives data on gene expression in 49 different tissues. It allows researchers to check if a certain DNA variant or SNP is associated with increased expression of a particular gene in each of the tissues. The preprint took the regions around the 8 DecodeME hits and looked for genes that have a significant association to a SNP in that same region in the GTEx dataset. The preprint then calculated if the GTEx gene expression signal matched the one found in DecodeME using an analysis called colocalization. But I suspect there is an issue here because it appears that the analysis only used SNPs that had reached the significance threshold in GTEx, rather than the full data.
Supplementary table 6 shows the datasets end in 'signif_pairs.parquet' which usually refers to this limited dataset and I was also able to largely replicate the coloc results in that table using the significant SNPs only retrieve using the GTEx API. The problem is that in several cases these are only a fraction of the SNPs that do not represent the data in this region.
Hopefully the plot below clarifies the problem. The gray dots are GTEx data* for SNPs that were also in DecodeME. The blue ones are the significant SNPs. The first graph shows that these were top results in our example namely the gene ARFGEF2 in visceral adipose tissue in the locus on chromosome 20. The second graph shows that these significant SNPs exclude the top SNPs in DecodeME. The preprint reports that these two signals 'colocalize' while this isn't actually the case if you use the full dataset.
View attachment 34492
*One caveat is that I didn't' actually manage to get the full GTEx dataset (the GTExwebsite say it's on a Google Cloud bucket but the link looks broken). So I used eQTL Catalogue version of the GTEx data (they used the same raw data but analysed it using their own standardised pipeline).
My guess is that many of the reported associations in Figure 4 do not hold up and are an artifact of using only the significant SNPs in the coloc analysis. Here's my reasoning about this. Coloc has 5 possible outcomes:
Because the analysis is only done if there is a significant association in both traits (DecodeME and gene expression), H3 and H4 are the most likely ones. Coloc uses a bayesian analysis and when n, the number of SNPs is small, the prior probability becomes more important than the actual evidence.
- H0 Neither trait has a genetic association in the region.
- H1 Only trait 1 is associated with the region.
- H2 Only trait 2 is associated with the region.
- H3 Both traits are associated, but they are driven by independent, distinct causal variants.
- H4 Both traits are associated and share a single, common causal variant.
So when n is very small, H4 is more likely than H3. That might explain why there are many associations in Figure 4, while a colocalization normally occurs in < 50% of GWAS hits.
- For H3 the prior is n * 1e-4 * (n-1) * 1* 1e-4
- For H4 the prior is n * 1e-5.
using the full (eQTL Catalog) dataset, I only found 4 eQTL associations in the chr20 locus (none involving ARFGEF2).
View attachment 34493
Again, thanks @ME/CFS Science Blog for spotting this.
ME/CFS Science Blog
Senior Member (Voting Rights)
Thanks, look forward to this analysis! Hope the UK biobank access is reopened soon (can imagine it must be a very frustrating situation for your team).Thank you. Good spot: yes, we agree. The DecodeME project deprecated this analysis quite soon after the preprint was posted. This meant that we hadn't since gone back to double- (or triple-) check its findings. Rather, the team was working on a completely different Figure 4, using very different methods, to prioritise variants & genes. The new Figure 4 analysis needs access to the UK Biobank compute facility ("the RAP") so - as with all analyses - we're waiting for UK Biobank to reopen the RAP.
Again, thanks @ME/CFS Science Blog for spotting this.
In some sense, it might be good news that fewer genes show PPH4 coloc as it might lower the number of potential causal genes.

ChronicallyOverIt
Senior Member (Voting Rights)
I’m not following this well enough at the moment. Does this mean some of the tier one genes could be reprioritized? Especially the dense ones, thinking of the HLA region with the BTN genes

chillier
Senior Member (Voting Rights)
Coloc problem
I think there might be an issue with the colocalization analysis and Figure 4 in the DecodeME preprint. This is important because these results determined whether a candidate gene is considered Tier 1 or not. In brief, In think the paper used only the significant SNPs from the GTExv10 data to match it with DecodeME data while the coloc analysis probably requires the full dataset.
GTEx gives data on gene expression in 49 different tissues. It allows researchers to check if a certain DNA variant or SNP is associated with increased expression of a particular gene in each of the tissues. The preprint took the regions around the 8 DecodeME hits and looked for genes that have a significant association to a SNP in that same region in the GTEx dataset. The preprint then calculated if the GTEx gene expression signal matched the one found in DecodeME using an analysis called colocalization. But I suspect there is an issue here because it appears that the analysis only used SNPs that had reached the significance threshold in GTEx, rather than the full data.
Supplementary table 6 shows the datasets end in 'signif_pairs.parquet' which usually refers to this limited dataset and I was also able to largely replicate the coloc results in that table using the significant SNPs only retrieve using the GTEx API. The problem is that in several cases these are only a fraction of the SNPs that do not represent the data in this region.
Hopefully the plot below clarifies the problem. The gray dots are GTEx data* for SNPs that were also in DecodeME. The blue ones are the significant SNPs. The first graph shows that these were top results in our example namely the gene ARFGEF2 in visceral adipose tissue in the locus on chromosome 20. The second graph shows that these significant SNPs exclude the top SNPs in DecodeME. The preprint reports that these two signals 'colocalize' while this isn't actually the case if you use the full dataset.
View attachment 34492
*One caveat is that I didn't' actually manage to get the full GTEx dataset (the GTExwebsite say it's on a Google Cloud bucket but the link looks broken). So I used eQTL Catalogue version of the GTEx data (they used the same raw data but analysed it using their own standardised pipeline).
My guess is that many of the reported associations in Figure 4 do not hold up and are an artifact of using only the significant SNPs in the coloc analysis. Here's my reasoning about this. Coloc has 5 possible outcomes:
Because the analysis is only done if there is a significant association in both traits (DecodeME and gene expression), H3 and H4 are the most likely ones. Coloc uses a bayesian analysis and when n, the number of SNPs is small, the prior probability becomes more important than the actual evidence.
- H0 Neither trait has a genetic association in the region.
- H1 Only trait 1 is associated with the region.
- H2 Only trait 2 is associated with the region.
- H3 Both traits are associated, but they are driven by independent, distinct causal variants.
- H4 Both traits are associated and share a single, common causal variant.
So when n is very small, H4 is more likely than H3. That might explain why there are many associations in Figure 4, while a colocalization normally occurs in < 50% of GWAS hits.
- For H3 the prior is n * 1e-4 * (n-1) * 1* 1e-4
- For H4 the prior is n * 1e-5.
using the full (eQTL Catalog) dataset, I only found 4 eQTL associations in the chr20 locus (none involving ARFGEF2).
View attachment 34493
This restricted set of significant colocalisations paints a more specific picture of something that looks kind of HPA axis-ish. Also potentially ties in to an association of 'free water in the cingulate gyrus' pointed out in the ARFGEF2 locus thread? Excited to see how the coloc analyses end up looking for the whole set, maybe it could point to a more specific story.
ME/CFS Science Blog
Senior Member (Voting Rights)
Think it would look something like this.Excited to see how the coloc analyses end up looking for the whole set

- Using the GTEx API, I checked for genes that have their transcription start site within 1 MB of one of the FUMA-intervals for one of the DecodeME hits.
- For each of those genes, I used the GTEx API to check whether it had a significant association in this genomic region in one of the tissues
- If the gene had an association, then I did coloc with the DecocdeME data in that region and the full data queried using the eQTL Catalog API.
- If the results point to the same causal SNP (PP.H4 > 0.75), it gets a bigger dot in the graph with the color representing the direction of effect.
Done with the help of AI
ME/CFS Science Blog
Senior Member (Voting Rights)
I'm not too keen on this eQTL analysis myself though because it's also influenced by window size and the most important genes might not show a lot of variation and thus eQTLs.
ChronicallyOverIt
Senior Member (Voting Rights)
Dang quite a different chart.
Was trans-eqtl run, would this change as well?
Was trans-eqtl run, would this change as well?
ChronicallyOverIt
Senior Member (Voting Rights)
Wow the CA10 is a pretty stark difference?
@Chris Ponting is it possible without the biobank just to correct the old coloc while waiting for the biobank to open to run the newer method you mentioned?
@Chris Ponting is it possible without the biobank just to correct the old coloc while waiting for the biobank to open to run the newer method you mentioned?
Youtube recording of the 24 September 2026 ME Support webinar featuring Chris Ponting is up:
Special Guest Speaker Event - Decoding ME: ME/CFS Genetics & biomarker studies by Professor Chris Ponting
Special Guest Speaker Event - Decoding ME: ME/CFS Genetics & biomarker studies by Professor Chris Ponting
ME/CFS Science Blog
Senior Member (Voting Rights)
From the talk around minute 27. Pretty much all autoimmune disorders show a peak and association to HLA, ME/CFS apparently doesn't.


V.R.T.
Senior Member (Voting Rights)
I've got to say, I find it really weird that the DecodeME tech could have hallucinated a link to the exact gene that had come up in iirc two separate studies before (HLA DQ). Are they confident that they won't find something going on there in SequenceME?From the talk around minute 27. Pretty much all autoimmune disorders show a peak and association to HLA, ME/CFS apparently doesn't.
View attachment 34605

Jonathan Edwards
Senior Member (Voting Rights)
I've got to say, I find it really weird that the DecodeME tech could have hallucinated a link to the exact gene that had come up in iirc two separate studies before (HLA DQ). Are they confident that they won't find something going on there in SequenceME?
I have discussed with a tissue typing expert with an interest in DQ. DQ is notorious for giving false leads. It is hugely polymorphic and is in linkage disequilibrium with other polymorphic genes that vary with ancestry. It sounds to me as if at least one of the previous studies may have fallen foul of the same issue that made the DecodeME team initially think DQ was a risk gene. There may still be some signal once all the analysis is done but it is going to be weak. For things like narcolepsy the signal is barn door.

Hoopoe
Senior Member (Voting Rights)
If HLA isn't involved, what other immune mechanisms could potentially be involved in the causation?
Do immune mechanisms exist that don't involve HLA and also no inflammation?
Maybe what is happening is that some neurological process can be disturbed by normal immune processes and then ends up triggering a cascade of dysregulation. Would that lead to the picture of no meaningful HLA involvemement and no meaningful chronic inflammation?
My insistence that the immune system be involved somehow results from the reports of flu-like illness and the association between infection and ME/CFS-like illness. There has to be a connection of some kind, but perhaps not the one that is expected.
Do immune mechanisms exist that don't involve HLA and also no inflammation?
Maybe what is happening is that some neurological process can be disturbed by normal immune processes and then ends up triggering a cascade of dysregulation. Would that lead to the picture of no meaningful HLA involvemement and no meaningful chronic inflammation?
My insistence that the immune system be involved somehow results from the reports of flu-like illness and the association between infection and ME/CFS-like illness. There has to be a connection of some kind, but perhaps not the one that is expected.
Last edited:
V.R.T.
Senior Member (Voting Rights)
If HLA isn't involved, what other immune mechanisms could potentially be involved in the causation?
One linked to innate immunity and the BTN genes is a possibility

DecodeME identified variants that passed the genome-wide significance threshold at this locus:
...
ID rsid Effect allele frequency Beta Log10(p) 6:26233159:A:G rs10946808 0.274226 0.0790095 7.93952 6:26239176:A:G rs9358913 0.261233 0.0825251 8.3862 6:26259579:G:A rs3999543 0.290621 0.0787843 8.17451
- Hutan
- btn2a1 btn2a2 decodeme decodemehit gamma-delta t cells genetics t cell receptor t cells
- Replies: 362
- Forum: Possible causes and predisposing factor discussion

Jonathan Edwards
Senior Member (Voting Rights)
If HLA isn't involved, what other immune mechanisms could potentially be involved in the causation?
All the innate immune steps can be involved. And so could specific adaptive responses to microbes, if they linked to more general mechanisms like cytokine production.
HLA-D links are mostly to autoimmune diseases and autoimmune diseases are not triggered by infections, so the lack of link is not very surprising. HLA-B has links to post-infective syndromes but not involving brain. The link between post-infective narcolepsy and DQ stands out as interesting. Narcolepsy also has the same DR link as MS, which raises questions about lymphocytes and brains.
Everything seems to point away from a specific adaptive antigen response in ME/CFS but I think other options remain open, particularly innate interactions that are as yet poorly documented.