Preprint Initial findings from the DecodeME genome-wide association study of myalgic encephalomyelitis/chronic fatigue syndrome, 2025, DecodeMe Collaboration

Why did decode focus on protein-coding genes only? Are dodgy miRNA pathways of no interest?
I'm not sure that is the case. The first thing they look for is the genetic signal, then they look to see what was captured by that genetic signal. I think that was mainly protein coding genes. I had a feeling there was at least one RNA species. I don't know if that showed up in the supplementary information?
 
I'm simply not sure this needs to be true.
All living things pretty much have to be genetically programmed to survive and to replicate because if not, they would not be around anymore.

The only way I can imagine that a virus might survive in a population if it causes people to essentially hibernate, is if it causes only some people to hibernate due to rare traits in those people.

Maybe others have some other ideas?
 
All living things pretty much have to be genetically programmed to survive and to replicate because if not, they would not be around anymore.
Fair. But it doesn't have to manifest in typical fashion, i.e. at the progressive expense of the infected. Take parasites, for example.

The only way I can imagine that a virus might survive in a population if it causes people to essentially hibernate, is if it causes only some people to hibernate due to rare traits in those people.

Maybe others have some other ideas?
Perhaps if it's not the virus that persists, or if it is, that it doesn't conform to usual characteristics. Similar to ME/CFS qualities. Of course, it doesn't have to be a virus.
 
On the topic of "what does DecodeME" show, my feeling is that it's really early for anyone to be saying with much confidence that the genes they found point to any specific pathway. From the DecodeME blog and paper respectively:
The signals discovered are involved in the immune and the nervous systems, indicating immunological and neurological causes to this poorly understood disease.
Overall, DecodeME shows that ME/CFS is partly caused by genes related to the immune and nervous systems.

Here are the candidate genes suggested by DecodeME:
chr1
RABGAP1L
DARS2
RC3H1
GPR52
ZBTB37
TNFSF4
ANKRD45
KLHL20
PRDX6
SERPINC1
SLC9C2

chr6q
FBXL4

chr6p
BTN2A2
TRIM38
ZNF322
ABT1
HFE
BTN3A3
HMGN4

chr12
SUDS3
PEBP1
VSIG10

chr13
OLFM4

chr15
CCPG1

chr17
CA10

chr20
CSE1L
ARFGEF2
DDX27
STAU1
ZNFX1
B4GALT5
PTGIS

Is it really possible to say that the above list of genes indicates "immunological causes"? Genuine question, since I don't know much about any of them. But my impression is that genes often have lots of unrelated functions. And the genes related to ME/CFS will likely be only a subset of genes from each locus above, if the right gene is even listed at all. So it feels like you could pretty much write any story you want based on the genes and gene functions you pick.

I'm more excited about the MAGMA analysis that found overexpression of ME/CFS-associated genes in the brain (though unfortunately not much more specific than that) as pointing to the nervous system since the technique is much less biased than trying to create a story from the literature.
 
On the topic of the brain expression, I don't remember much discussion about this yet. While all 13 brain tissues had enrichment of ME/CFS genes, there is an ordering of most to least significant that might give some clues.
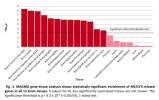
1755126187821.png

Written out and grouped:
  • High
    • Brain Frontal Cortex BA9: ~8.3
    • Brain Cortex: ~8.0
    • Brain Anterior cingulate cortex BA24: ~7.9
  • Medium
    • Brain Nucleus accumbens basal ganglia: ~7.0
    • Brain Caudate basal ganglia: ~6.2
    • Brain Amygdala: ~6.1
    • Brain Hippocampus: ~6.0
    • Brain Cerebellar Hemisphere: ~6.0
    • Brain Hypothalamus: ~5.9
    • Brain Cerebellum: ~5.8
    • Brain Putamen basal ganglia: ~5.5
  • Low
    • Brain Spinal cord cervical c-1: ~3.9
    • Brain Substantia nigra: ~3.6
    • Pituitary: ~2.5
I added pituitary gland even though it didn't reach the significance threshold since it's the one other brain-related tissue they tested against.

So genes associated with ME/CFS tend to be the genes relatively more expressed than other genes in the brain. And this seems to be most prominent in the cortex/frontal cortex and least prominent in the pituitary gland. Does this ordering mean anything? Are the ones near the top maybe more associated with "higher order" functions?
 
Last edited:
On the topic of the brain expression, I don't remember much discussion about this yet. While all 13 brain tissues had enrichment of ME/CFS genes, there is an ordering of most to least significant that might give some clues.
These were the ME/CFS enriched genes in brain tissue from table S4.
LRRC7
STAU1
CSE1L
DARS2
ZBTB37
TAOK3
ARFGEF2
DNAH10OS
ZNF664
CCDC92
HIST1H4H
ZNF311
SUDS3

From paper
MAGMA analysis
Next, we tested for positive relationships between gene expression in a tissue type and gene based ME/CFS association strengths, using MAGMA (42). Thirteen genes were significantly associated with ME/CFS in a MAGMA gene-based test of 18,637 genes (p < 0.05/18637; Table S4). We considered 54 tissue types and identified significant enrichment of these genes’ expression for 13 (p < 0.05/54), all of which were brain regions (Fig. 3). MAGMA analysis found no significant associations between other gene sets and ME/CFS after applying the Bonferroni correction for multiple tests (pBonferroni < 0.05).
 
These were the ME/CFS enriched genes in brain tissue from table S4.
I'm just learning about this, but I think technically these 13 genes weren't necessarily enriched in brain tissue.

I'm having ChatGPT explain MAGMA to me, and it says it's basically two different analyses. The 13 highest scoring genes from the first part are likely to play a role in the brain association, but it's not a guarantee that all 13 are "brain genes". They're just 13 potentially ME/CFS-associated genes, like the candidate genes from the other part of the paper, just found using a different method.
ChatGPT said:
Step 1 — Gene-based test (no tissue involved)

“Thirteen genes were significantly associated with ME/CFS in a MAGMA gene-based test of 18,637 genes…”
  • This is the gene-based analysis stage.
  • Input: GWAS summary stats + SNP-to-gene mapping.
  • MAGMA combines SNP signals into a gene-wide p-value for each gene.
  • Output: a table of ~18,637 genes, each with a Z-score/p-value.
  • At this stage, no tissue data, no pathways, nothing — just “how strong is the GWAS signal for this gene?”


Step 2 — Gene–tissue enrichment (gene-property analysis)

“…We considered 54 tissue types and identified significant enrichment of these genes’ expression for 13…”
  • Now they take the full list of 18,637 gene scores from Step 1 (not just the 13 significant ones).
  • For each tissue:
    • They have expression data for each gene.
    • They regress gene Z-scores on expression in that tissue.
  • This is the gene-property analysis in MAGMA.
  • Result: brain tissues show a significant positive slope → genes more expressed in brain tend to have stronger GWAS signals.


Step 3 — Gene set analysis (different again)

“…MAGMA analysis found no significant associations between other gene sets and ME/CFS…”
  • This is the gene-set analysis: testing specific predefined lists (GO terms, pathways, curated functional sets).
  • Input: Binary indicator for each gene’s membership in the set.
  • Result: no pathways survived Bonferroni correction.
 
@Chris Ponting Would you be kind enough to help us interpret the MAGMA analysis paragraph in the paper (discussion in above post).
MAGMA analysis
Next, we tested for positive relationships between gene expression in a tissue type and gene based ME/CFS association strengths, using MAGMA (42). Thirteen genes were significantly associated with ME/CFS in a MAGMA gene-based test of 18,637 genes (p < 0.05/18637; Table S4). We considered 54 tissue types and identified significant enrichment of these genes’ expression for 13 (p < 0.05/54), all of which were brain regions (Fig. 3). MAGMA analysis found no significant associations between other gene sets and ME/CFS after applying the Bonferroni correction for multiple tests (pBonferroni < 0.05).
Are the 13 genes in table S4 found from gene based analysis only and then tested for tissue, or is the list a gene-tissue enrichment analysis presented as a gene set - table S4 and then tested against all tissue types in Fig 3. Or is fig 3 showing something different? Which analysis is the last sentence on significance referring too - is it a tissue one or non-tissue one?
 
However the gene reference to the variants listed in the paper seems to be using the GRCh38 (hg38) reference. That means if we want to compare a variant location using the UK Biobank online tool we have to map the coordinates. For example, OLFM4 variant 13-53194927-GT-G is a GRCh38 reference that maps to 13-53769062-GT-G in GRCh37. That seems to map to rs35306732.
I'm not sure about the one in your previous post. I would expect it to be in the BioBank. But maybe that website GeneAtlas doesn't show every variant they tested for whatever reason.
My guess is that this variant is absent from the dbSNP Release used by GeneAtlas at the time, but present in the reference panel that we used for imputation (namely, UK Biobank Whole Genome Sequencing variants). Not all variants are listed in all resources unfortunately.
I found sort of found an answer to this question in supplementary table S3. They actually mapped
GRCh38 variant 13:53194927-GT-G rs35306732
to
GRCh37 variant 13:53750354:A:G rs1923773(P) (I assume this is original as array data should be decoded to GRCh37).

However that SNP (rs1923773) doesn't seem to match the location shown by dbSNP for GRCh38 which is chr13:53176219 (not 13:53194927). So the locations don't match by quite a distance.

So I sort of found my answer in that (P) must mean something (I don't know what specifically) and the locations given by SNP decoding are different even for accounting for hg19 vs hg38. I still don't know how to interpret the location data between GRCh37 and GRCh38. The array data should have been decoded to GRCh37 (to match the control data) but they used GRCh38 WGS Biobank data for imputation...........

EDIT: using GeneBe Liftover tool
GRCh38 variant 13:53194927 (paper + S3) => GRCh37 variant 13:53769062 (table S3 lists 13:53750354).
GRCh37 variant 13:53750354 (table S3) ===> GRCh38 variant 13:53176219

EDIT : Looking at the text in the main paper (P) probably refers to Proxy, a nearby variant used for replication. So not an apples to apples comparison for comparing DecodeME data for replication tests.

EDIT : rs1923773 has a p-value of 0.24 in the Original UK Biobank CFS cohort.
 
Last edited:
I found sort of found an answer to this question in supplementary table S3. They actually mapped
GRCh38 variant 13:53194927-GT-G rs35306732
to
GRCh37 variant 13:53750354:A:G rs1923773(P) (I assume this is original as array data should be decoded to GRCh37).

However that SNP (rs1923773) doesn't seem to match the location shown by dbSNP for GRCh38 which is chr13:53176219 (not 13:53194927). So the locations don't match by quite a distance.

So I sort of found my answer in that (P) must mean something (I don't know what specifically) and the locations given by SNP decoding are different. I still don't know how to interpret the location data between GRCh37 and GRCh38. The array data should have been decoded to GRCh37 (to match the control data) but they used GRCh38 WGS Biobank data for imputation...........
I think the rsids that have a "P" (for proxy) refer to another variant in LD with the DecodeME SNP that they tested in the other cohorts if the other cohorts didn't have the variant in question.

The ones you named:
1. GRCh38 variant 13:53194927-GT-G rs35306732
2. GRCh37 variant 13:53750354:A:G rs1923773(P)

These are two different variants. The GRCh37 version of the first one is 13-53769062-GT-G. You can switch between versions with the "Dataset" option in the top right on gnomAD. And rs IDs are the same whether they refer to the GRCh37 or 38 version.
 
So why don't they show a data comparison between GRCh38 variant rs35306732 13:53194927 (paper) and GRCh38 variant rs1923773(P) 13:53176219 in DecodeME dataset only to show that comparing rs1923773(P) to an external data set is even valuable? They must have the data. Perhaps they did. I don't know.
 
On the topic of "what does DecodeME" show, my feeling is that it's really early for anyone to be saying with much confidence that the genes they found point to any specific pathway. From the DecodeME blog and paper respectively:


Here are the candidate genes suggested by DecodeME:


Is it really possible to say that the above list of genes indicates "immunological causes"? Genuine question, since I don't know much about any of them. But my impression is that genes often have lots of unrelated functions. And the genes related to ME/CFS will likely be only a subset of genes from each locus above, if the right gene is even listed at all. So it feels like you could pretty much write any story you want based on the genes and gene functions you pick.

I'm more excited about the MAGMA analysis that found overexpression of ME/CFS-associated genes in the brain (though unfortunately not much more specific than that) as pointing to the nervous system since the technique is much less biased than trying to create a story from the literature.
On the face of it, the magma analysis is the stand out finding, and highlights stuff going on in the brain. However, my understanding is that magma is not as robust as the EQTL analysis, though I think that's probably debatable. I think that's the reason why the authors is placed less emphasis on it in the paper.

Also, MAG highlights 13 genes. Not sure if the supplementary information lists the 13? That would be interesting to see.

I agree that, until things are nailed down, it's hard to be precise.

Buthe neurological claim, that fits with magma, which you say you find most convincing. There is also the CA 10 gene, which is the only one in that genetic signal. And then there is the microglial gene as well. , that is a glial sound rather than a neuron, but I think it's covered by neurological broadly.

As for cherry picking a story, I'm not so sure.
I think if you picked eight tiny regions of DNA at random, across numerous chromosomes, you wouldn't find anything like so many immune genes as this. And I have the impression that the paper focused on immune genes, because that's what they found more of than anything else. Not because it fitted with preconceived ideas.

I wonder if it would be worth putting a question together here for Chris, or for all the authors as a comment on the pre-print. One of the reasons it's out there is to get feedback.
 
my feeling is that it's really early for anyone to be saying with much confidence that the genes they found point to any specific pathway.
I tend to agree. For most of the loci there are multiple potential genes implicated and each of the genes are involved in multiple pathways.

You could perhaps argue that there are more genes involved in the immune and nervous system than expected. But it's hard to say how many immune-related links we would expect with 8 hits. We would have to random sample some SNP hits or loci, count the number of potential implicated genes and their immune-related pathways. It would be a lot of counting and not entirely objective.

The MAGMA analysis seems to take 13 genes from the SNP comparison but this seems like an informed guess. We don't know if those 13 genes are really implicated. Many don't match with the FUMA/coloc analysis.
 
Back
Top Bottom