Measuring Cognitive Exertion

Discussion in 'Trial design including bias, placebo effect' started by chillier, Jun 12, 2023.

  1. ME/CFS Skeptic

    ME/CFS Skeptic Senior Member (Voting Rights)

    Messages:
    3,665
    Location:
    Belgium
    Did you manage to do the analysis you planned?

    Quite impressive what you are doing by the way, hope it shows some interesting results. In my personal case, the most demanding cognitive efforts would be reading complicated texts like scientific papers and I think that would be difficult to see in keyboard presses or saccades.
     
    alktipping, Kitty, chillier and 2 others like this.
  2. chillier

    chillier Senior Member (Voting Rights)

    Messages:
    194
    Thankyou! I'm glad to hear it. I've been distracted with other things recently but I haven't forgotten about this thread and I do plan to make a post with the results. I've done most of the things I want to to do and made some figures so mainly waiting for when I've got the energy to finish up.
     
  3. chillier

    chillier Senior Member (Voting Rights)

    Messages:
    194
    Results 1

    Data shape

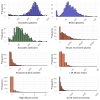
    Firstly, let's take a look at the shape of the data. Below are histograms showing the distribution of the data for the main features I've been looking at. There is a strong left skew in the counts for all the keyboard and mouse related data in orange. In particular for the mouse movement there is an inflation of zero values, because in many data points (a count over a 10 minute interval) I would not use the mouse at all, such as when watching a video. The data for right mouse clicks is also heavily 0 weighted; it is rare that right clicks are made at all.

    For the saccades, the centre of mass in the glasses distribution is around 800 saccades compared to about 300 in the webcam distribution, which suggests a much increased sensitivity (or arguably more false positives) in the glasses data. A smaller peak around zero in both the glasses and webcam data probably reflect times when I was away from the camera or not wearing the glasses.

    plot_1_cognitive_data_histograms.png

    Saccade detection sensitivity is correlated with ambient infrared lighting.

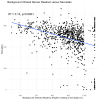
    Now that a set of a data has been generated I can investigate the effect of background infrared light on the ability of the glasses sensors to detect saccades. The glasses set-up used two sensors, one to detect saccades and the other to calibrate (pointed to an area just below the eye), adjusting for sudden changes in infrared reflectance that was due to something other than a saccade. I also took readings from this sensor to get an indication of the overall ambient infrared lighting at any one time. A 2D scatter plot of the background infrared readout versus the saccades is shown below.

    plot_3_2D_Scatter_backgroundlight_saccades.png

    Unfortunately there is a significant small negative correlation between Saccade count and infrared sensor readout (a high readout means low ambient infrared), which indicates that when the ambient light is dim (such as in the evening) the sensitivity decreases. What this likely means is that the reflectance sensor is largely detecting infrared reflected from the sun, rather than from it's own infrared LED. The solution could be to get a sensor with a more powerful LED. I would want to be careful that any infrared LED is not powerful enough to cause eye damage over long term use. I have not modelled this effect into the subsequent analysis as it was not a part of my analysis plan to do so, but in future this could be the way to go.
     
    ME/CFS Skeptic likes this.
  4. chillier

    chillier Senior Member (Voting Rights)

    Messages:
    194
    Results 2

    Hypothesis testing results show significant differences in keyboard features but not saccades

    The results of the hypothesis testing plan that I outlined previously are shown in the three strip-scatter plots below. Data points from the different activity categories were binned into either cognitively 'demanding' or 'not demanding' categories. This was based on my subjective opinion of what kinds of activities I - broadly speaking - find require exertion. It is therefore a fairly artificial distinction but I still think it should provide a broad way of measuring any differences. The way things have been binned was decided before this analysis in a previous post.

    Both 'Mouse movement' and 'Keyboard button presses' are highly significant and in both cases you can see the mass of the distribution has shifted towards higher values in the 'demanding' category. The saccades (as measured by glasses) however do not remain significant after Bonferroni multiple test correction. The saccade counts are nominally higher in the 'demanding' category.

    plot_2_hypothesis_test_strip_plots_w_pvals.png

    Combining keyboard features in a predictive model does not improve performance over 'Left mouse clicks' alone

    As I have collected multiple features for keyboard usage I wanted to see if these features could be combined together in a model that would give a better approximation of whether a data point belonged to 'demanding' or 'not demanding' cognitive activity. To do this I have used a simple logistic regression model to map the following keyboard features: 'Mouse movement', 'keyboard button presses', 'left clicks', and 'scroll wheel increments' to the binary response variable 'demanding' or 'not demanding.' I have of course split the data into training and testing partitions, so the performance of the model can be checked fairly against the testing partition.

    Given a data point with values for 'mouse movement', 'keyboard button presses' etc. the linear part of the model will return a single continuous 'linear predictor' value. I have plotted these values for the training and test datasets to illustrate how well they can separate the 'demanding' or 'not demanding' categories:
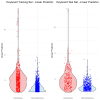
    plot_5_Keyboard_training_test_set_linear_predictors.png

    The overall performance of the model - as well as the performances for each of the individual features on their own - was assessed with Receiver Operating Characteristic curve analysis. Simply put, the greater the area under the curve, the better that measure is able to correctly distinguish between the 'demanding' and 'non demanding' classes.
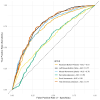
    plot_6_ROC_plots.png

    You can see that saccades (which were not included in the model) do not perform well, and that the model performance on the test set (AUC = 0.77) is no better than left mouse clicks (AUC = 0.77) alone. This suggests that the different keyboard related features represent redundant information, and that combining them does not add any useful information.
     
    Last edited: Mar 1, 2024
    Peter Trewhitt likes this.
  5. chillier

    chillier Senior Member (Voting Rights)

    Messages:
    194
    Results 3

    Breakdown of Left Clicks by individual activity

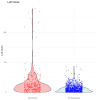
    As left clicks appear to be the most informative feature, I have shown the strip scatter plot for left clicks below, as well as a break down the left click counts by activity (ordered by mean from lowest to highest)

    plot_7_Left_Clicks_strip_plot.png

    plot_8_left_click_strip_by_activity.png

    There is an overall trend for more 'demanding' activities to involve more left clicks than 'not demanding' activities. Predictably, very cognitively demanding activities like 'reading academic material' do not involve much clicking and so are not well captured. It does a particularly good job of picking up 'writing academic material', 'problem solving' (which usually means programming), and 'mental exercises' (which involve a lot of clicking answering quick fire questions usually about some music theory topic).

    Rolling averages of left clicks over time could have some use in monitoring cognitive exertion

    Despite having a strong trend towards indicating a 'demanding' activity, the data does not cleanly distinguish between categories and has a lot of murky overlap, even in the activities that it is able to distinguish relatively well. In real life, activities usually take place over continuous blocks of time and not completely random 10 minute intervals. By averaging over longer periods of time it might be possible to increase the efficacy of this approach to monitoring cognitive exertion over time. Below I have taken 3 days semi-randomly (discarding a day if it does not contain much data), and convolved over the time series data for that day averaging the left clicks over a half hour window. These plots show these rolling average left clicks next to whether or not I was doing cognitively 'demanding' or 'not demanding' activity. Blank spaces indicate missing data:

    plot_9_oneday_timeplot_leftclicks.png plot_10_anotherday_timeplot_leftclicks.png plot_11_yetanotherday_timeplot_leftclicks.png
     
    Peter Trewhitt likes this.
  6. chillier

    chillier Senior Member (Voting Rights)

    Messages:
    194
    The Bottom Line

    Keyboard features, in particular left mouse button clicks are able to distinguish between demanding and not demanding cognitive activity in some circumstances (writing, coding) but not others (reading papers), and the the highly subjective individual judgement of what is and isn't cognitive exertion will also affect the practical value of this. There is a nominal increase in saccades seen during demanding cognitive exertion, but it is not significant after multiple test correction with this analysis scheme. The infrared sensors used to detect saccades appear to be affected by background infrared probably from the sun, which leads to a reduced sensitivity in darker conditions.

    In my opinion there is still potential in the use of saccades to measure cognitive exertion. Despite the large increases in sensitivity the glasses achieved over the webcam, the sensitivity is still too low to detect the tiny saccades made during reading. A part of the solution to this could be to use more, and more highly powered sensors that overwhelm the background sunlight infrared (but are still weak enough to not cause damage). My glasses device after all is very jankily jerry rigged and I'm sure it would be possible to create a more powerful device.
     

Share This Page