Results 2
Hypothesis testing results show significant differences in keyboard features but not saccades
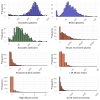
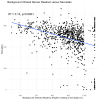
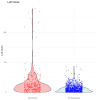
The results of the hypothesis testing plan that I outlined previously are shown in the three strip-scatter plots below. Data points from the different activity categories were binned into either cognitively 'demanding' or 'not demanding' categories. This was based on my subjective opinion of what kinds of activities I - broadly speaking - find require exertion. It is therefore a fairly artificial distinction but I still think it should provide a broad way of measuring any differences. The way things have been binned was decided before this analysis in a previous post.
Both 'Mouse movement' and 'Keyboard button presses' are highly significant and in both cases you can see the mass of the distribution has shifted towards higher values in the 'demanding' category. The saccades (as measured by glasses) however do not remain significant after Bonferroni multiple test correction. The saccade counts are nominally higher in the 'demanding' category.
 Combining keyboard features in a predictive model does not improve performance over 'Left mouse clicks' alone
As I have collected multiple features for keyboard usage I wanted to see if these features could be combined together in a model that would give a better approximation of whether a data point belonged to 'demanding' or 'not demanding' cognitive activity. To do this I have used a simple logistic regression model to map the following keyboard features: 'Mouse movement', 'keyboard button presses', 'left clicks', and 'scroll wheel increments' to the binary response variable 'demanding' or 'not demanding.' I have of course split the data into training and testing partitions, so the performance of the model can be checked fairly against the testing partition.
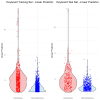
Given a data point with values for 'mouse movement', 'keyboard button presses' etc. the linear part of the model will return a single continuous 'linear predictor' value. I have plotted these values for the training and test datasets to illustrate how well they can separate the 'demanding' or 'not demanding' categories:
The overall performance of the model - as well as the performances for each of the individual features on their own - was assessed with Receiver Operating Characteristic curve analysis. Simply put, the greater the area under the curve, the better that measure is able to correctly distinguish between the 'demanding' and 'non demanding' classes.
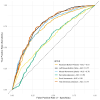
You can see that saccades (which were not included in the model) do not perform well, and that the model performance on the test set (AUC = 0.77) is no better than left mouse clicks (AUC = 0.77) alone. This suggests that the different keyboard related features represent redundant information, and that combining them does not add any useful information.

