jnmaciuch
Senior Member (Voting Rights)
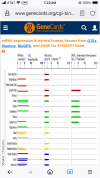
Great start @Sasha! Usually I’ll start at gene cards as well, and then the first thing I’ll do is scroll allllll the way down to the tissue expression chart that looks something like this:

That’s a compilation from various databases looking at where RNA for that gene has been detected in the human body. Detected RNA doesn’t always mean that the protein is being produced, but it can be a good starting point for understanding where it might be playing important roles. The Human Protein Atlas is also a good resource, as it can sometimes tell you where the protein has actually been detected (i.e. where the gene is actually functioning). That will give you a good idea of whether it’s a gene that is really only functioning in one organ/context, or if it’s a gene that has just been characterized extensively in only one context.
The summary sections of gene cards are usually a mishmash of one-line summaries from various papers that mention the gene name is some context, so read them as such. There is no coherent narrative being presented here. Unfortunately gene cards is not particularly forthcoming about the sources that these summaries are drawing from. If something sticks out to me, I’ll usually just Google the terms and the gene name and see what comes up, like “ERK pathway SYNGAP1” or “Autism SYNGAP1”.
Usually studies related to those more technical terms will be cell biology studies where they knocked out the gene and found that the cell was unable to do XYZ. Sometimes you’ll find knockout mouse models for exploring more complicated organ systems. The ones related to human disease names are going to be genetics studies that provide no mechanistic insight. If the paper is pure technical gobbledygook you can skip to the discussion, just keeping in mind that you’re reading someone’s attempt to weave a narrative and it may present a shinier story than what the data actually shows.
I agree with @hotblack that AI might be good for defining basic concepts—I’d expect it to at least point you in the right direction for what the ERK pathway is, for example. But if you ask it “how might SYNGAP1 relate to ME/CFS?” it will just draw from whatever half baked theories people have proposed about HPA axis or neural connectivity, probably.
Once you do this for enough genes you’ll probably see certain words and phrases start to come up that paint a story in your head. And of course that process of pattern recognition will often be driven by confirmation bias, but there’s not much you can do about it for these purposes. It’s still a useful exercise just for driving some learning!
