Altered TRPM3-Dependent Cytosolic and Mitochondrial Calcium Influx in Natural Killer Cells…, 2026, Magawa, Eaton-Fitch, Marshall-Gradisnik+

SNT Gatchaman

Senior Member (Voting Rights)
Staff member
Altered TRPM3-Dependent Cytosolic and Mitochondrial Calcium Influx in Natural Killer Cells of Post-COVID-19 Condition Patients
Chandi Tabeth Magawa; Natalie Eaton-Fitch; Katsuhiko Muraki; Sonya Marshall-Gradisnik

According to the World Health Organization (WHO), approximately 6% of COVID-19 cases develop serious long-term sequelae referred to as post-COVID-19 condition (PCC). Immunological disturbances such as persistent activation of immune cells and reduced cytotoxicity by natural killer (NK) cells are reported as key aspects in PCC. Recently, electrophysiological studies by our group demonstrated impairment of transient receptor potential melastatin 3 (TRPM3) ion channels in NK cells from PCC patients. The significant reduction in TRPM3 channel function and reduced functional activity by NK cells warrants further investigation.

Hence, using live cell calcium (Ca2+) imaging ex vivo, we examined the downstream impact of TRPM3 ion channel dysfunction on intracellular and mitochondrial Ca2+ mobilization in NK cells from N = 8 PCC patients, age and sex matched to N = 8 PCC healthy controls (HC).

Our findings provide new evidence of altered passive and TRPM3-mediated Ca2+ influx, significantly impacting cytoplasmic and mitochondrial Ca2+ mobilization in PCC. Passive cytosolic Ca2+ influx amplitude (p < 0.0001) was significantly reduced in PCC; however, passive mitochondrial Ca2+ mobilization (p < 0.0001) was significantly increased. Importantly, cytoplasmic and mitochondrial response rates (slope, p < 0.001) to pregnenolone sulphate stimulation were significantly reduced in PCC. Consequently, TRPM3-dependent cytosolic (p < 0.001) and mitochondrial (p < 0.0005) Ca2+ mobilization were significantly reduced in PCC compared with HC.

Altered ion channel Ca2+ signalling can severely impact both the immune system and bioenergetic processes, potentially leading to broader systemic dysregulations underpinning the pathomechanism of the PCC condition, and warrants further investigations.

Web | DOI | PDF | European Journal of Immunology | Open Access
 
The study is on 16 people:
Sixteen participants were included in this study: N = 8 HC and N = 8 PCC patients

I don't know what they mean by pooled or nested here:
The Mann–Whitney U test was performed on nested nonparametric data.
Group comparisons for pooled data (b–e) were performed with unadjusted two-sided Mann–Whitney U tests on nested data.

If they mean they combined the cells together from each person into one statistic, the p-values are too small for a Mann-Whitney on 8 points per group.
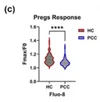
In contrast, following PregS stimulation, the slope (Figure 2d) and cytosolic Ca2+ influx amplitude (Figure 2c, p < 0.0001) were significantly reduced in PCC (Mdn = 1.06, 1.00–1.19) compared with HC (Mdn = 1.11, 1.01–1.39), indicating altered channel function.

Just the large overlap for the data with 16 individuals in figure 2c should make a Mann-Whitney barely, if at all, significant, but they report p<0.0001.
1784761350846.webp

The smallest possible p-value from a Mann-Whitney test with 8 individuals per group is 0.0001554. That's the p-value if there is no overlap at all. Their p-value is smaller than that, so I think the Mann-Whitney includes more than 16 data points.

See a similar comment about another paper of theirs:
I’ve only used GraphPad sparingly but looking at some of the violin plots, getting p<0.0001 with a very small median difference and near complete overlap using Mann-Whitney U-test on N=10 seems unusual, to put it lightly. Unless data was explicitly averaged by participant I have no idea how pseudoreplication could have been avoided here with that specific test.

Or see discussion about pseudoreplication in several other papers from this group: https://s4me.info/threads/large-sca...25-marshall-gradisnik-et-al.47665/post-668047
 
We need some kind of hall of fame thread for these things:
they report p<0.0001.
1784761350846.webp

The basically flat recovery (or fatigue?) improvement graph SNT found the other day deserves a spot as well.
 
Can anyone tell me what kind of correction they should have used here? Boneferri correction? Or Benjamini-Hochberg FDR?

Queuing some stats quest…
The main issue isn't about multiple test correction. It's that they should either have combined the data from all of the cells for each individual into one number per individual, for example by averaging, or used a statistical test that is meant for data like this, like a mixed effects model.

Imagine going outside and stopping the first two people you see wearing a red shirt and the first two people wearing a green shirt. You measure how tall each one is, and compare the groups. People vary in height, so they won't be exactly the same, and maybe both people in the red group are taller than both people in the green group. But that could just be randomness. You probably wouldn't conclude from this small dataset that "for some reason, red shirted people tend to be taller than green shirted people". The next four people you pick, it might be the green group that is taller.

The statistical test sees your two groups of two where one group is taller than the other and says, "That's not surprising at all. Even if there were no underlying height difference between red shirts and green shirts, you might easily get this difference if you only look at 4 random people". (What it really "says" is it gives a high p-value.)

Now imagine you measure the height of each of those same four people 1000 times each. And you tell your friend that each measurement is from a whole different person. Your friend thinks you picked 2000 people randomly wearing a red shirt and 2000 people wearing a green shirts, and every single red shirted person was taller than all the green shirted people. That'd be so absurd, they'd almost have to conclude that there is some underlying reason that red shirted people are taller.

Similarly, the statistical test says "wow, that is a surprising. If there were no real underlying height difference between red shirts and green shirts, seeing this large of a difference between such large groups would be highly unlikely" (it really "says" a low p-value).

In this study, instead of different height measurements from the same person, it's measurements of different cells from the same person. Like height measurements, this is basically re-measuring each individual. It might help in terms of providing a very precise cell average to measure many cells from the same person, but the cells can't be treated as if they came from whole new people.
 
So I think what they did is use a feature of GraphPad that allows you to set a column for “nesting” observations from the same participant.

There’s a page for nested t-test but I couldn’t find a similar page for Mann-Whitney U test:

The page unfortunately doesn’t provide much detail on what it’s actually calculating behind the scenes but it says that it fits a mixed effect model, which probably means that participant ID is included as a fixed or random effect. There are valid reasons for doing something like this (it’s usually used as a workaround for pseudoreplication, actually), but it’s also been repeatedly shown that using this procedure for small sample sizes tends to inflate p-values. If I had to guess, small sample size plus a large number of “nested replicates” per sample would really skew towards small p-values.

Some discussion of that here (mostly section 2.5-2.6ish) though I can’t say I processed everything in this paper from a quick skim:

TLDR not a clear case of pseudoreplication as much as it’s probably the weird results of using a statistical procedure in a very non-ideal use case.
 
There’s a page for nested t-test but I couldn’t find a similar page for Mann-Whitney U test:

I did find this R function that seems to be some sort of Mann-Whitney mixed effects model: https://github.com/douglasgscofield/nestedRanksTest

Though I couldn't find it in GraphPad docs, as you say.

My gut says it's just pseudoreplication based on how extremely low those p-values are, but I guess I can't say for certain. I see that GraphPad has a free trial of Prism. I might try that to explore and see if there's any "nested" Mann-Whitney option.
 
Back
Top Bottom