Metabolic adaptation and fragility in healthy 3-D in vitro skeletal muscle tissues exposed to [CFS] and Long COVID-19 sera, 2025, Mughal+

Looking at the researchers:

Authors: Sheeza Mughal1,8*, Félix Andújar-Sánchez2,3,4, Maria Sabater-Arcis1 , Glória Garrabou2,3,4 , Joaquim Fernández-Solà3 , Jose Alegre-Martin5,6, Ramon Sanmartin-Sentañes5,6 Jesús Castro-Marrero6 , Anna EsteveCodina7,8 , Eloi Casals7,8 , Juan M. Fernández-Costa1*, and Javier Ramón-Azcón1,9*

Affiliations:

1Institute for Bioengineering of Catalonia (IBEC), Barcelona Institute of Science and Technology (BIST); Barcelona

2Inherited Metabolic Disorders and Muscular Diseases Research Group, Institutd’Investigacions Biomèdiques August Pi i Sunyer (IDIBAPS) and Faculty of Medicine and Health Sciences, University of Barcelona, 08036 Barcelona

3Department of Internal Medicine, Hospital Clinic of Barcelona, 08036 Barcelona

4CIBERER—Spanish Biomedical Research Centre in Rare Diseases, 28029 Madrid

5Division of Rheumatology, Vall d'Hebron University Hospital, Universitat Autònoma deBarcelona, 08035 Barcelona

6Unit of Research in ME/CFSyalgic Encephalomyelitis/Chronic Fatigue Syndrome and Long COVID, Division of Rheumatology Research, Vall d'Hebron Research Institute, Universitat Autònoma de Barcelona, 08035 Barcelona

7Centro Nacional de Análisis Genomico (CNAG), Baldiri Reixac 4, 08028 Barcelona

8Universitat de Barcelona (UB), Barcelona, Spain

9ICREA-Institució Catalana de Recerca i Estudis Avançats; Barcelona, Spain

Acknowledgements
We extend gratitude to Dr Benedicte Chazaud from the Institut NeuroMyoGène, Lyon, France, for providing us the human immortalized muscle precursor cells and to the MicroFabSpace and Microscopy Characterization Facility, Unit 7 of Unique Scientific and Technical Infrastructures (ICTS) ‘NANBIOSIS’ from Networking Biomedical Research Centre-Bioengineering, Biomaterials and Nanomedicine (CIBER-BBN) at the Institute for Bioengineering of Catalonia (IBEC) for their technical support.

We would also like to acknowledge the thorough critique and suggestions on this manuscript presented by Dr. Adolfo López de Munain Arregui from the Clinical Neurosciences Unit of Policlínica Gipuzkoa, San Sebastian, Spain and Professor Dr. Karl Morten, University of Oxford John Radcliff Hospital, The United Kingdom. Finally, we would also like to express our appreciation to the entire team of Biosensors for Bioengineering group at IBEC for their valuable
feedback during the manuscript preparation process.

It's good to hear @DMissa's comments about the primary author. Here's an article about her. She's had experience with engineered muscle tissue experiments before.

The senior author is at ICREA and looks to have been working with engineered tissue for a long time. He has a number of publications about muscle diseases, muscle dystrophy. The researcher we know interested in FSHD genetics might know something about this team.

Seeing Jesus Castro-Marrero on the author list rang a few alarm bells, as we have seen some less than great research from him, with some concerns about management of conflicts of interest in relation to supplement manufacturers. But here, it looks as though he was not involved in the analysis. It's possible that he was brought in as the ME/CFS expert and didn't have much involvement.

I like the background of some of the authors, in rare diseases and inherited metabolic disorders and muscular diseases. The funding sources looked fine. Some of the work associated with Professor Morten hasn't had quite the level of rigour that I would have liked to have seen. I guess though, the number of academics I'd like to see as reviewers of ME/CFS research is unfortunately very small.

It would be great if our Spanish members or others who know this team could give us some more background. Even better if the researchers would like to come to the forum to talk about their work. I hope that they won't be put off by the scrutiny, it's a protective mechanism, we don't want to get too excited. We are looking for the problems.

If replicated, these findings could be very important. It would be wonderful to have validation for the odd feeling of intermittent loss of power in muscles.

I wonder what the researchers are planning to do next.
 
Last edited:
There are quite a few questionable statements about peripheral things and hypotheses in the Introduction.
Agree. It would be better if authors, here as in most other studies, just skipped the whole general background stuff which a) almost always consists of a mix of poorly evidenced received wisdom and the patently obvious e.g. ME is nasty to have, and b) is unnecessary. Why not just limit the background to what’s relevant to the study at hand. In this case something like:

PwME report rapid fatiguability of muscles. The reason for this remains to be elucidated. Previous studies on muscle have used x and y methods and found... Nobody has tried (our) method z before so we’re doing it here. Here are our results...
But, I'm keen to get on to the good stuff.
The study itself is over my head but we seem to be back at the possibility of ‘something in (or missing from) the blood’?

More questions arising:

If both this study and the Ryback study are correct, do Ryback’s negative findings narrow down the possibilities of what could be causing the changes seen in the present study?

If this study is correct, would we expect to see observable changes in mitochondria and/or in muscle tissue? If so, have we already seen them in past studies, maybe without recognising them for what they were? Or would we need to be looking via different methods?

What is the significance of the short-term 48h findings given that our own muscles are exposed to our serum all the time?

Upstream vs downstream: the muscle changes seen here may or may not contribute to some of our symptoms and if they do would be a potential target for symptom relief treatments, but the real question has to be how to reverse engineer our way back upstream to whatever is different in our blood in the first place, and why – have I got that right?
 
Could the difference be that this is investigating a muscle tissue preparation (with a longer setup time) which could then include secreted extracellular matrix components, vs multiple but independent and disorganised muscle cells in a well? Abnormal signalling and pathological cell effects might require ECM components.
That was my first thought as well, but the methods state that the experiments measuring oxygen consumption rate were done on seeded myoblasts, not on the differentiated myotubes like the rest of the experiments.

What I can’t figure out is what would make this study resemble the Fluge et al. results when the Ryback study tried to mimic the Fluge study’s protocol as much as possible. The best idea I have so far is that this study and the Fluge study included participants in active PEM, but no way to really assess that.
 
Carrying on with the reading, nearly at the end of the results now.

2.3. Structural Analyses indicates Hypertrophy, Mitochondrial Hyperfusion and elevated Oxygen Consumption Capacity

So, their earlier findings led them to think that muscle cells and mitochondria are not functioning well and are being damaged.


***** Myotube hypertrophy
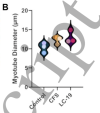
Quantification of myotube diameter was performed by calculating Feret’s diameter for individual, transversely cut tubes. The diameter appeared to be enlarged compared to the controls indicating hypertrophic tendencies in diseased ME/CFS and LC-19 tissues (Figure 5A, B).
Figure 5B does show the myotube diameter is higher in the diseased groups, albeit, still really small samples. The authors suggest that this is hypertrophy in response to stress. Is it reasonable to think that there would be something like a 20% increase in myotube diameter just from the application of diseased serum for 48 hours?

Screenshot 2025-08-02 at 3.21.09 pm.png

It seems a bit unlikely to me. Have I got something wrong? Possibly. I need to check the methods. I also wonder if there were checks on the consistency of the engineered muscle tissue before the different serum samples were applied. I wonder if, rather than actually growing larger, there is effectively swelling some problem in fluid homeostasis?

There is some staining of the myotubes with markers of sarcomeric actinic, F-actin and nuclei (Fig 5A) I'm not sure what to make of those results.


***** Mitochondrial fusion
Moreover, quantification of mitochondrial networks showed hyperfusion evidenced by increased mitochondrial branching and mean branch length (Figures 3C-E).
I think they mean to refer to Figures 5C-E there. Charts 5C and 5D do indeed show increased 'mitochondrial branching' and 'branch length' in the diseased samples. In 5E, I'm assuming the blue blobs are the nucleus. It's hard to see the mitochondria, branched or not.

Screenshot 2025-08-02 at 3.52.13 pm.png

Mitochondria had a high aspect ratio and appeared to be hyperbranched in the cytoplasmic space across the length of a myotube as well as close to the nuclei (Figure 5E). Fusion has been considered to be a positive response related to mitochondrial health, but evidence suggests that above control levels, excess fusion equates to an increased stress response (42–44).


********Oxygen consumption rate (on the next post)
 
Last edited:
I think they mean to refer to Figures 5C-E there. Charts 5C and 5D do indeed show increased 'mitochondrial branching' and 'branch length' in the diseased samples. I don't know what they mean by branching though, or how to interpret 5E. 5E shows mitochondrial that are quite oval, in the myoblast cells, they are not elongated, certainly not branched. It's not making much sense to me yet.
DAPI is a nuclear stain, TOMM20 (the grayish [edit: pinkish? color—I have my blue light filter and brightness low so having trouble seeing the exact color]) is what’s staining the outer membrane of the mitochondria.

The images are looking at branching of the mitochondrial networks rather than the mitochondria themselves—usually in muscle cells mitochondria will organize themselves in lines arranged end to end. Perpendicular “branching” is therefore usually an indication of hyper fusion. So the representative images are trying to show that the TOMM20 staining follows parallel lines more in controls than in the ME/CFS sample.

It probably should have been explained better in the legend but unfortunately most researchers will just assume that DAPI is common knowledge.
 
Last edited:
********Oxygen consumption rate

We were further intrigued to check mitochondrial functional capacity by the MitoStress Test and observed an increase in the overall oxygen consumption rate (OCR) by the diseased cells compared to the controls (Figure 5F). The Extracellular Acidification Rate (ECAR) measures the glycolytic process in the cells as a response to treatments. Both the OCR and the EACR were the highest in ME/CFS patients compared to the other two groups (Figure 5G).

Here is the method. As @jnmaciuch says, the tests were not done on the myotubes, but rather cells seeded into the Seahorse wells.
Immortalized human muscle progenitor cells were seeded at a density of 4000 cells per well in Seahorse XF HS Mini cell culture plates. Cells were allowed to proliferate until the formation of a uniform monolayer with little to no empty spaces. Once confluent, the growth medium was replaced with differentiation medium for 6 days after which 5% serum treated was initiated for 48 hours. Once the 48 h treatment was completed, the media was removed, and cells were washed with PBS thrice. The standard assay media was prepared by supplementing Seahorse XF DMEM Media with 10 mM Glucose, 1 mM pyruvate and 2 mM L-Glutamine. Subsequent analyses and treatment steps were followed from the Seahorse XF Cell Mito Stress Test Kit user guide.
It sounds as though a set number of myoblast cells were seeded, but then they were allowed to proliferate to create 'a uniform monolayer with little to no empty spaces'. Then the cells were given a different medium, a 'differentiation medium' for 6 days. And then 5% serum for 48 hours.

So, the number of cells in the wells probably varied. I haven't seen anything about making sure the number of cells was standardised. Daniel, I think it was you that said that that could that be a problem? I know Charlie has been tagged already; it would be great to get some thoughts from him and Audrey.

And, I don't know what the differentiation medium was doing, but perhaps they weren't just myoblasts, maybe they were actually differentiated myotubes by the time they were tested? Also, there might be differences in the serum concentration and the time the serum was applied for.

There is quite a lot of variation in the oxygen consumption rate within a group.

And, I'm not sure that the story is hanging together particularly well in terms of explaining the differences between the ME/CFS and LC groups. I think we have to keep in mind that large variation between seahorse assays even with the same samples, no matter how carefully done, and also the very small sample sizes in this experiment.

To check the dynamics within each treatment we normalized the rates of all mitochondrial processes to basal respirations and confirmed that in LC-19 samples, nonmitochondrial respiration is consuming most of the oxygen (Figure S4F). However, for ME/CFS samples all processes appear to be upregulated signaling not only a heavy energy burden but also perhaps an attempt to maintain muscle contractile force.
 
Last edited:
Here is the method. As @jnmaciuch says, the tests were not done on the myotubes, but rather cells seeded into the Seahorse wells.
Ah it seems I missed the detail about the differentiation medium. The myoblasts would have become myotubes after that. But to @SNT Gatchaman ‘s earlier point, it looks like it was still a monolayer rather than the 3D architecture from the other experiments. And it seems like differentiation medium wasn’t used in the Ryback or Fluge studies
 
DAPI is a nuclear stain, TOMM20 (the grayish color) is what’s staining the outer membrane of the mitochondria.

The images are looking at branching of the mitochondrial networks rather than the mitochondria themselves—usually in muscle cells mitochondria will organize themselves in lines arranged end to end. Perpendicular “branching” is therefore usually an indication of hyper fusion. So the representative images are trying to show that the TOMM20 staining follows parallel lines more in controls than in the ME/CFS sample.

It probably should have been explained better in the legend but unfortunately most researchers will just assume that DAPI is common knowledge.
Thanks jnmaciuch. I did eventually twig that the big blue lumps were nuclei, not mitochondria, and changed my post.

Your explanation helps me understand what I should be looking for, but I'm still not really seeing it.
Mitochondria had a high aspect ratio and appeared to be hyperbranched in the cytoplasmic space across the length of a myotube as well as close to the nuclei (Figure 5E).
If I had to pick an image that matched that description, I'd choose the control image.
 
Tissue Weakness and Fragility increases with exposure along with Mitochondrial Fragmentation
For this experiment, we used tissues obtained from the same batch of encapsulation to avoid variability in handling and exposed them to LC-19 and control sera for 48, 96 and 144 hours.
So, to test the tissue strength, they used some of the engineered muscle tissue and applied LC and control sera for the three different lengths of time. Note, no ME/CFS sera in this experiment.

The diseased tissues were weaker as evidenced by a lower T50% compared to the controls (Figure 6a)
I think this is interesting. They weren't testing tear strength of the tissue here, they were testing the ability of the muscle to contract (as they did before).

Figures 6A-C
Screenshot 2025-08-02 at 5.13.55 pm.png
A) Relative absolute force at 50 Hz for Control. The dotted line indicates the time taken for the force to drop to 50% of its peak value under sustained tetanic stimulation of 50 Hz (T50%)
B) Relative absolute force at 50 Hz for LC-19 tissues over time.
C) Brightfield images of progressive muscle exposure to Control and LC sera

(That's the last of the results.)

In A, the blue lines are the control at the different serum exposure times. B, with the orange lines, is the same for the LC serum. The lines are the force exerted by the tissue when stimulated. Note that the charts are of relative force, for that tissue and that exposure. So, all the experiments achieve 100% of the force at the peak, just because that is how the chart is set up. But, tissue with longer exposure to the LC serum cannot sustain the force as long.

Figure 6c shows examples of the tissue, with the LC tissue looking less robust over time.

Tissue survival decreased sharply with time for both diseased and control groups, but the decline was two-fold higher for the former than the latter.

If you look at Figure 6f, I'm not sure that there are really differences in mitochondrial branching between groups. The differences between groups don't seem to be significant. The very small samples sizes don't help.

We then analyzed mitochondrial morphology and quantified mitochondrial networks for each time point. Our data indicated a decline in mitochondrial branching and mean branch length. The mitochondria not only assumed the familiar globular geometry observed during fragmentation but also toroidal conformations indicating changes in mitochondrial membrane potential at 144 hours of patient serum exposure (Figure 6F, G).
The toroidal conformations are typically observed with FCCP administration at high dosages due to depolarization of the mitochondrial membrane, resulting in a drop in mitochondrial membrane potential and uncoupling of mitochondrial oxidative phosphorylation and ATP synthesis (47). These findings confirmed mitochondrial stress induced by systemic stress factors coupled with myotube atrophy at longer exposures. Our results of prolonged exposure to patient sera further warrant investigation due to small sample size but signpost at progressive deterioration of muscle structure, function and mitochondrial energy production, mimicking the conditions observed in patients.

There are some photos of the cells with the mitochondria looking more odd in the LC and ME/CFS samples. This is a bit shaky, and the authors seem to acknowledge that, noting the very small sample sizes. It does look though, that the muscle tissue is less able to handle the stress of being incubated with LC or ME/CFS serum rather than healthy serum.

That's the last of the results.
 
Last edited:
Back
Top Bottom