Preprint Replicated blood-based biomarkers for Myalgic Encephalomyelitis not explicable by inactivity, 2024, Beentjes, Ponting et al

Interview with Chris Ponting by David Tuller about this study from Nov 19, 2024:


I watched the video, and a couple of points stood out to me:

1) he says that they didn’t get blood samples from severe patients for this study, only mild and moderate, and some of the people in the ME patient group even described themselves as being in good health.

2) he says that because it’s blood, not genetics, they can’t know the causational direction - are these abnormalities what’s causing ME, or are they a downstream effect of ME.
 
I think that’s quite normal. Your frame of reference shifts, so «good» now would have been «bad» before. Simply because you’re better than you were or could have been.
I’m pretty sure that in this research they excluded people who said their health was good, on the grounds that they might be right. It’s possible this includes people who misremembered a previous diagnosis of chronic fatigue and are now in good health.

A paper about the quality of this UK Biobank cohort was referenced in the new “unequal access” paper from the group, but it turns out that is a pre-print that hasn’t come out yet, but will do soon. I think we’ll get a much clearer picture then.

Ref that isn't yet up:
Samms GL, Ponting CP. Defining a High-Quality Myalgic Encephalomyelitis/Chronic Fatigue Syndrome cohort in UK Biobank. 2025.
 
Last edited:
some of the people in the ME patient group even described themselves as being in good health.

It depends what they mean by good health too.

My GP thinks I'm in excellent health. I take up every screening and vaccination, and don't yet have signs of the cardiovascular, pulmonary and metabolic diseases that are common after age 65. The metrics he uses don't happen to include any of the things that cause my disabilities.
 
Last edited:
A notable addition to the published version - made at the request of one of the peer reviewers - was a replication attempt of 14 of the traits using the US-based "All of Us" programme (Fig 8, p13):
Peer review said:
Reviewer 3 requested that we incorporate “data from an additional biobank or independent source [as this] would strengthen the findings”. To test for replication, we used data from the US-based All of Us (AoU) program, testing 14 traits for 903 ME/CFS cases and 75,943 controls, of which 9 were replicated with the same direction of effect as UKB.
Paper said:
Using the AoU Controlled Tier v8 database, we defined 903 ME/CFS cases and 75,943 controls, and tested 12 blood traits (glucose, triglyceride, CRP, AST, ALT, ALP, HDL-C, GGT, HbA1c, leucocyte count, neutrophil count, urea) and 2 composite blood traits (TyG and TG-to-HDL-C ratio) using a 20-fold cross-validation (CV) SL (“Methods”), with stratified CV following SL best practices (Phillips et al, 2023). Of the 14 blood traits tested, 9 were significant in the AoU cohort (FDR <0.05; Dataset EV12; Fig. 8B) with the same direction of effect seen in the UKB.
 
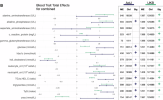
A notable addition to the published version - made at the request of one of the peer reviewers - was a replication attempt of 14 of the traits using the US-based "All of Us" programme (Fig 8, p13):
Copying the figure showing the results of the replication attempt:
Screenshot_20250619-225335.png
(B) Associational total effects (TE) of ME/CFS on molecular and cellular blood traits in All of Us and UKB, for males and females combined. Age and sex are taken as confounders. Error bars indicate 95% confidence intervals and the central point represents the population average estimate. Note the different scale and unit of measurement used for each trait (x axis). Significant results (FDR <0.05) are indicated by “+” for positive effects and “−” for negative effects. Where there is no symbol shown, the effect was not significant. With the exception of urea, all significant blood traits show concordant directions of effect between AoU and UKB. Full results and sample sizes of each analysis can be found in Dataset EV12.

Significantly increased in both
Alkaline phosphatase
glucose
hba1c
leukocyte count
neutrophil count
triglyceride/HDL-C ratio
triglycerides
triglyceride glucose index

Significantly decreased in both
HDL-C
 
The above mostly seem like markers I'd expect to be associated with high BMI.

On average, the body mass index (BMI; UKB field 21,001) of cases is significantly, but only slightly, higher than the BMI of controls (27.96 ± 4.62 for 386 male cases vs 26.80 ± 3.58 for 55,572 male controls, with t = 4.92 and P = 10−5, Welch’s t test; 27.70 ± 5.83 for 1069 females cases vs 25.82 ± 4.39 for 75,731 female controls with t = 10.68 and P < 10−12, Welch’s t test).
There was only slightly higher BMI in cases (~1 point for males and ~2 points for females), but with sample sizes this large, could that be enough to make BMI markers significant?

They seem to have done some kind of controlling for BMI, but I don't know what it means:
Rather than prediction algorithms, we used semi-parametric estimation theory to quantify population averages, closing any causal gap due to age, sex and BMI (Fig. EV5; Dataset EV13).
Figure EV5. NDE of ME/CFS on blood traits for females and males, for mediator 874, with BMI included as a confounding variable.

Edit: I think BMI was only used as a confounding variable in one analysis that corresponds to dataset EV13?
 
Last edited:
The main NDE/NIE models didn't include BMI (only age & sex) but following peer review comments (comment 3, p16 of the peer review) they re-estimated the blood-trait NDEs with BMI as an additional confounder. Fig. EV5 shows male vs. female-specific BMI adjusted z-scores. So the classical adiposity-sensitive traits remain significant after BMI adjustment. One potential issue that I can see is that IIRC BMI is a crude proxy for adiposity & ectopic fat - I wonder if something like waist/hip ratio is in the UKB dataset? The BMI sensitivity analysis was also described only for the NDEs of the 63 blood-trait outcomes, not for the metabolite or protein-level models.
 
The main NDE/NIE models didn't include BMI (only age & sex) but following peer review comments (comment 3, p16 of the peer review) they re-estimated the blood-trait NDEs with BMI as an additional confounder. Fig. EV5 shows male vs. female-specific BMI adjusted z-scores. So the classical adiposity-sensitive traits remain significant after BMI adjustment.
I see. Still, maybe it would have made sense to just try to match the distributions of BMI exactly by excluding as many controls as necessary. There were so many controls that I'm not sure that would have been much of an issue in terms of statistical power.

Maybe we should be looking for markers that were significant and going in the opposite direction of what you'd expect due to BMI as the most interesting.
 
Back
Top Bottom