Symptom Response to Low-Dose Naltrexone in Fibromyalgia: An Exploratory Analysis of the Randomized Placebo-Controlled FINAL Trial, 2026, Nielsen et al

voner

Senior Member (Voting Rights)
Symptom Response to Low-Dose Naltrexone in Fibromyalgia: An Exploratory Analysis of the Randomized Placebo-Controlled FINAL Trial

Nielsen, Maria Juul; Vaegter, Henrik Bjarke; Bruun, Karin Due

Abstract

Background:
Fibromyalgia (FM) remains difficult to manage due to a highly variable symptom profile. The "FINAL" randomized, placebo-controlled trial examined the efficacy of low-dose naltrexone (LDN) on pain in women with FM, showing no significant difference in pain reduction at the group level but potentially higher 30% pain response rates. Analysis of secondary outcomes showed potential improvements in memory problems.

Objectives: This exploratory analysis aimed to further investigate individual responses to LDN treatment by analyzing 30% responder rates for six secondary FM outcomes.

Methods: The FINAL trial included 99 women with FM who were randomized 1:1 to treatment with LDN or placebo for 12 weeks. Based on original data from this trial, 30% response rates were assessed for the six selected secondary outcomes: tenderness, fatigue, sleep disturbances, depression, memory problems, and stiffness. Risk ratios (RR) with 95% confidence intervals (CI) were calculated to assess differences between groups.

Results: No significant differences were found between treatment groups for any of the symptom response categories. The highest RR was observed for memory (RR = 1.67, 95% CI: 0.82-2.95), followed by sleep (RR = 1.28, 95% CI: 0.92-2.64), stiffness (RR = 1.26, 95% CI: 0.84-2.89, p = .47), tenderness (RR = 1.16, 95% CI: 0.88-2.67), fatigue (RR = 1.10, 95% CI: (0.78-3.13) and depression (RR = 0.96, 95% CI: 0.92-2.66).

Conclusions: Response rates for 30% improvement in six selected nonpain outcomes were similar after 12 weeks treatment with LDN or placebo in women with FM. Larger studies investigating 30% response rates are warranted.

Keywords: Depression; Exploratory analysis; Fatigue; Fibromyalgia; Low dose Naltrexone; Memory problems; Naltrexone; Sleep disturbances; Stiffness; Tenderness.

Web | DOI | Pain Management Nursing
 
I'm glad they did this analysis. Yes, they're trying to salvage something from a negative trial, but applying the 30% rule of thumb for improvement in pain research to non-pain outcomes is something I'd like to see more of.

It's better than the statistically derived minimum important differences that have been used in the UK studies of GET/CBT, for example, where we get things like 8 points on a scale of 0-100 being considered clinically important.
30 % of what? The baseline value or the scale?

30 % more of 30 would be 9, which is lower than the usual 10 % threshold for the 100 point scales.
 
30 % of what? The baseline value or the scale?

30 % more of 30 would be 9, which is lower than the usual 10 % threshold for the 100 point scales.
I'd prefer it to be 30% of the scale, but in pain studies, it's of your own baseline value. So if you have a VAS pain of 7, then to be considered improved, you'd need to move down to 5 or less. I'd quite like to move down that much.

If your baseline pain level is 5, you'd have to move down to 3.5 or lower.

People with low baseline pain aren't usually included in pain studies.

So if that were applied to the SF36 physical function scale, to be considered improved, the average person with moderate ME/CFS with a baseline of 45 would have to improve by at least 13.5 points to be considered improved, rather than 8 or 10.

To make this work, I think you'd need the scales to be like pain scales, where lower scores are better. Otherwise the more severe would be considered improved with trifling changes.
 
The PRT study was on low lever pain, and I think that applies to most BPS pain studies I’ve seen.
Which study is that?

In the 2021 Asher, Gordon, Schubiner study, for example:
Participants aged 21 to 70 years with back pain for at least half the days of the last 6 months and 1-week average pain intensity score of 4 of 10 or greater at screening were recruited from the community in Boulder, Colorado.

People with negligible or mild pain are excluded from pain studies I've seen.
 
Which study is that?

In the 2021 Asher, Gordon, Schubiner study, for example:


People with negligible or mild pain are excluded from pain studies I've seen.
For example that. The median baseline pain was 4.1 with the Brief Pain Inventory Short Form. That’s fairly low levels of pain in my book.

Different scales from 1-10 use different cutoffs, and the threshold for mild is usually between 3 and 5.
 
Different scales from 1-10 use different cutoffs, and the threshold for mild is usually between 3 and 5.
https://www.sciencedirect.com/science/article/pii/S1524904225002486
In the abstract they write:
Values for mild pain ranged between scores 0 and 5, with the most cited range being 1-4. Moderate pain ranged from 3 to 8, with 4-8 as the most cited range. Severe pain ranged from 5 to 10, with the most popular category of 7-10.
So 4 is considered on the border of mild and moderate pain.

For context, in the "CFS in the NHS" dataset, i.e. the data for Collin & Crawley 2017, for the whole group of 357 people with ME/CFS attending NHS specialist centres who provided pain scores at both baseline and 1-ish year, mean baseline pain was 51.4, so the equivalent of 5 on the scales we’re talking about here. That mean is essentially determined by those with moderate ME/CFS because they're the biggest group.

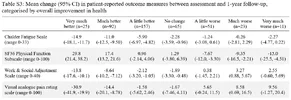
But what we're talking about is measuring change. This is from the addition file 1 to Collin & Crawley 2017. Using the 30% cut-off on a sample with mean baseline pain score of 51.4, the average pain score would need to reduce by 15.4 to be considered as improvement. And in this table, we can see that the mean change in pain for those who reported themselves "much better" on the Clinical Global Impression of health was 14.4:

1786789829723.webp

So yeah, I'd rather ≥30% improvement be used in studies than what we've had to date.

If we look at Crawley et al. 2013, here's what they did:
We defined clinically useful improvements within each person as having a difference of 2 points on the total Chalder Fatigue Scale and a difference of 11 points on the SF-36 physical function subscale between the baseline and follow-up measurements. We chose these cut-offs because they equated to 0.5 SD of the distribution of the baseline measurements.
Median Chalder score was 28 (IQR 23–30). Using the ≥30% improvement criterion, the clinically useful improvement would have gone from 2 to 8.4 for the average patient. So if people are going to insist on using the Chalder scale despite all its problems, then at least let's not pretend that a reduction of 2 means improvement.

For SF36 PF, it's closer: 12 points instead of 11.

This doesn't remove the fundamental issues with patient-reported measures in open-label trials. It's just saying, "Aim higher." In studies without a control group, it would help to reduce the daft claims of almost everyone improving in a clinically useful way.

The median baseline pain was 4.1 with the Brief Pain Inventory Short Form. That’s fairly low levels of pain in my book.

Back to Ashar et al. They report that to be included, participants need to have:
1-week average pain intensity score of 4 of 10 or greater at screening
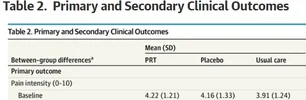
But they ended up with a cohort barely meeting that criterion overall, and one arm not meeting that criterion:

1786791379444.webp

To end up with those means and SDs, there must have been a drop in pain scores between screening and baseline assessment. Being accepted onto a trial could itself be therapeutic. The relief of knowing that someone is going to try to help you soon. The excitement of those around you at the thought of you being in a trial.
 
Last edited:
For context, in the "CFS in the NHS" dataset, i.e. the data for Collin & Crawley 2017, for the whole group of 357 people with ME/CFS attending NHS specialist centres who provided pain scores at both baseline and 1-ish year, mean baseline pain was 51.4, so the equivalent of 5 on the scales we’re talking about here. That mean is essentially determined by those with moderate ME/CFS because they're the biggest group.
Coming back to this @Utsikt, as a more comparable number to the 4.1 in Asher et al. would require excluding those with baseline pain less than 4.

If we do that to the CFS in the NHS dataset, then the mean baseline pain of the remaining group - those with baseline pain of 4 or more (n=235) is 67.3, equivalent to just less than 7 on a 0-10 scale.
 
Last edited:
I thought these were helpful descriptions of what each number is supposed to mean:

https://specialistshospitalshreveport.com/patient-resources/using-the-pain-scale/ said:

Using the Pain Scale​

If you want your pain to be taken seriously,
It is important that you take the pain scale seriously.


Because pain is subjective, it is difficult to explain what you’re feeling to another person—even your own doctor. To effectively use the pain scale, familiarize yourself with the levels before your procedure, identifying what key levels are indicative to your pain level. Following a surgery or procedure, typically we tell patients to continue to take medications that allow them to maintain a level of “5 or below.”

0 – Pain Free

Mild Pain – Nagging, annoying, but doesn’t really interfere with daily living activities.

1 – Pain is very mild, barely noticeable. Most of the time you don’t think about it.

2 – Minor pain. Annoying and may have occasional stronger twinges.

3 – Pain is noticeable and distracting, however, you can get used to it and adapt.

Moderate Pain – Interferes significantly with daily living activities.

4 – Moderate pain. If you are deeply involved in an activity, it can be ignored for a period of time, but is still distracting.

5 – Moderately strong pain. It can’t be ignored for more than a few minutes, but with effort you still can manage to work or participate in some social activities.

6 – Moderately strong pain that interferes with normal daily activities. Difficulty concentrating.

Severe Pain – Disabling; unable to perform daily living activities.

7 – Severe pain that dominates your senses and significantly limits your ability to perform normal daily activities or maintain social relationships. Interferes with sleep.

8 – Intense pain. Physical activity is severely limited. Conversing requires great effort.

9 – Excruciating pain. Unable to converse. Crying out and/or moaning uncontrollably.

10 – Unspeakable pain. Bedridden and possibly delirious. Very few people will ever experience this level of pain.
 
I thought these were helpful descriptions of what each number is supposed to mean:
Sure, but if you ask someone else they’ll give you a different list. That’s my point: 4 is within the range of 1 to 3-5 that’s considered «mild pain», so it can’t be labeled «moderate» pain with certainty.

And if the pain is already within the «can probably get used to it» window, it’s no wonder you can get people to report thinking less about it if that’s what they are told to do.
 
Sure, but if you ask someone else they’ll give you a different list. That’s my point: 4 is within the range of 1 to 3-5 that’s considered «mild pain»,
I posted the descriptions because I thought people reading the thread who aren't familiar with these scales might find them useful, not to prove a point.

Two things. First, that range is as said above, not actually supported by the study you cited. The study you cited shows large variation in ranges used by researchers. And 4 is not safely within the mild range in most of the studies they looked at. It's either at the very upper limit of mild, in an undefined region between mild and moderate, or in the moderate range. I can't see if Asher et al. provided their scale, but tell me if I missed it.

Second, if the mean of the group is 4, and it's normally distributed, then about half are above that.

I think we have to be careful of underestimating other conditions' pain just because ours is worse.

That Asher et al.'s participants' pain was lower than that of pwME/CFS doesn't explain the group differences they found, which are not restricted to differences in 30% improvment rates:
Large group differences in pain were observed at posttreatment, with a mean (SD) pain score of 1.18 (1.24) in the PRT group, 2.84 (1.64) in the placebo group, and 3.13 (1.45) in the usual care group. Hedges g was −1.14 for PRT vs placebo and −1.74 for PRT vs usual care (P < .001).

Of 151 total participants, 33 of 50 participants (66%) randomized to PRT were pain-free or nearly pain-free at posttreatment (reporting a pain intensity score of 0 or 1 of 10), compared with 10 of 51 participants (20%) randomized to placebo and 5 of 50 participants (10%) randomized to usual care.

This bit of the conversation started because I said I'd prefer if ME/CFS researchers used 30% improvement than what is currently used. With the average pain for us, excluding those below 4, being 6.7 (see posts #8 and #9 above), researchers would only be able to claim improvement if their treatment moved us right down to 4.7. Whereas, if I've done the maths right, the 0.5 standard deviation method would mean researchers would claim improvement if they brought the group mean down to 6.0.

I'd prefer the former.
 
Two things. First, that range is as said above, not actually supported by the study you cited. The study you cited shows large variation in ranges used by researchers.
The study I cited shows that mild stop as 3-5 depending on the scale and the interpretation. Both are arbitrary, but it shows that the patients were at the lower end, and barely within the properly bothersome territory.
And 4 is not safely within the mild range in most of the studies they looked at.
My last comment didn’t say it’s safely within mild.
It's either at the very upper limit of mild, in an undefined region between mild and moderate, or in the moderate range. I can't see if Asher et al. provided their scale, but tell me if I missed it.
They said which scale they used, but the interpretation of that scale, and any other 1-10 scale varies between sources.
Second, if the mean of the group is 4, and it's normally distributed, then about half are above that.
And half are below.
I think we have to be careful of underestimating other conditions' pain just because ours is worse.
I’m not underestimating it, just pointing out that pain past a certain threshold is much harder to ignore, which the scale you shared even has built into it.
That Asher et al.'s participants' pain was lower than that of pwME/CFS doesn't explain the group differences they found, which are not restricted to differences in 30% improvment rates:
If lower levels of pain is easier to ignore if you’re told to ignore it, compared to higher levels of pain, then a lower baseline can be part of the explanation for the large difference (i.e. more bias).
I'd prefer the former.
I agree but I think 30 % of baseline is still too generous for lower pain levels. I think it should be at least the highest of 30 % of baseline or 20 % of the scale.

This is related to the problem with cohen’s d. The change is divided by the SD, which is smaller for lower values because SD is usually correlated with the absolute value. So you end up with small differences in absolute values giving relatively large cohen’s ds.
 
I agree but I think 30 % of baseline is still too generous for lower pain levels. I think it should be at least the highest of 30 % of baseline or 20 % of the scale.
I agree. But I don't understand why you want to keep talking about it when the pain levels of the average pwME/CFS, and I would guess lots of other symptoms, are not in that range where the 30% improvement. becomes problematic. They are in the range where the 30% improvement would mean researchers have to reach a higher bar in order to claim improvement.

The thread is about an FM pain study where they did not find differences in 30% improvement rates in non-pain symptoms. If they did find differences, and we looked at the data and saw that participants' baseline scores were in those lower levels where the 30% improvement gets dodgy, then the discussion would make sense to me. Since they didn't, and since I implied my understanding that low baseline values way up thread;

Editing to include first quote here:
Evergreen said:
To make this work, I think you'd need the scales to be like pain scales, where lower scores are better. Otherwise the more severe would be considered improved with trifling changes.

People with low baseline pain aren't usually included in pain studies.
I just don't understand why we're still talking about it.
 
Last edited:
Edit: Am leaving this post here as it is relevant to some posts above, and have copied it to the thread on Collin & Crawley 2017.

Intervention studies in ME/CFS often have inclusion criteria like PACE's requirement for an SF36PF score <=65.

I thought it would be interesting to see how this would affect the mean pain of included vs excluded participants.

In the "CFS in the NHS" dataset, i.e. the data for Collin & Crawley 2017:
  • People with baseline SF36PF score ≤65 (n=299) had mean pain score =55.0 (SD 24.1)
  • People with baseline SF36PF score ≥66 (n=59) had mean pain score =33.0 (SD 26.1)
Pain was measured in that study on a 0-100 scale. On a 0-10 scale, divide by 10. So the less capable group had pain of 5.5 on a 0-10 scale, and the more physically capable group, who would not have been eligible for PACE, had pain of 3.3 on a 0-10 scale.

In pain studies, 5.5 would usually be considered moderate pain, and 3.3 would usually be considered mild pain. The standard deviations above, however, look quite large, so there is overlap between the two groups rather than clear separation. That means that some people who would be considered to have relatively good physical function still have moderate pain.
 
Last edited:
I agree. But I don't understand why you want to keep talking about it when the pain levels of the average pwME/CFS, and I would guess lots of other symptoms, are not in that range where the 30% improvement. becomes problematic. They are in the range where the 30% improvement would mean researchers have to reach a higher bar in order to claim improvement.

The thread is about an FM pain study where they did not find differences in 30% improvement rates in non-pain symptoms. If they did find differences, and we looked at the data and saw that participants' baseline scores were in those lower levels where the 30% improvement gets dodgy, then the discussion would make sense to me. Since they didn't, and since I implied my understanding that low baseline values way up thread;

Editing to include first quote here:


I just don't understand why we're still talking about it.
I think I said that pain studies frequently include low baseline pain patients, and referenced the PRT study.

Then you pointed out that 4 was considered moderate in the PRT study, and I pointed out that 3-5 can be mild depending on who is interpreting which scale.

So I think the conclusion is that pain studies (at least the BPS ones) frequently include the lower end of moderate and higher end of mild pain. This is relevant because of milder pain being easier to ignore or at least report improvements for - i.e. it’s easier to induce bias in that population.

But I agree that it’s off track for this thread.

My point about 30 % of baseline and 20 % of the scale is that I think their threshold of 30 % change often is too generous when the baseline is low. It’s more of a general point.

Thank you for digging up the sources you’ve found, it’s been useful to look at how things have been done elsewhere!
 
We agree that 30% improvement of low scores is problematic. I think that problem is largely moot because those with low scores are usually not included in the first place.

Let's agree to disagree on this point: I do not agree that a group mean of 4 indicates low levels of pain.

To get an idea of pain levels in other diseases, here is the first study I came across with a quick search on pain in MS Brown & Slee 2015:
Patients were required to have daily pain that was attributed to MS by the treating physician. Pain had to be present for a minimum of 2 months prior to screening, with a score of 4 or greater on the 24-hour worst pain score rated on an 11-point (0–10) Likert scale on the majority of recorded days.
1786977575613.webp
1786977462516.webp


And then bone mets in cancer, known to be horrifically painful Geerling et al. 2023:
Eligible patients were 18 years or older, had uncomplicated painful bone metastases of a solid tumor, had experienced a selfreported worst pain intensity of 5 on a 0–10 NRS before single fraction or short-course radiotherapy (1–5 fractions, at the discretion of the treating radiation oncologist), had a life expectancy of 3 months with a WHO performance status 0–3, and were able to complete questionnaires and follow instructions.
1786977837365.webp
1786977816132.webp

I do not think people with MS in a trial for a pain relieving medication and some people with cancer in a trial of pain-relieving radiotherapy (those 1 SD below the mean) have low levels of pain.

If a trial of brain retraining in MS or cancer showed significant group differences, it would not be because (some of) the participants had mild pain that was easy to ignore.
 
@Evergreen my point is that you can find plenty of scales and papers and interpretations where 4 or 5 is considered mild. So we can’t say that 4 is definitively not mild. I agree that me saying they had «mild pain» without any caveats was too far.

How you frame a scale will also matter a lot. If you’ve asked to compare to the worst pain you’ve ever felt when having a very painful condition, most severe pain will be rated lower on average because it can get so much worse.

What we do know is that the PRT study chose a very subjective scale, a non-strict threshold, and recruited participants at the very bottom of the interval. They are maximising the effect of the bias.
 
Back
Top Bottom