tralfamadorian97
Established Member (Voting Rights)
I agree. I would like more detail on the participant numbers.Though I don't understand what those smaller numbers are based on, and why not all 15,328 would be included.

I agree. I would like more detail on the participant numbers.Though I don't understand what those smaller numbers are based on, and why not all 15,328 would be included.

Could there be a clue to bistability / mechanism .
I don't know if we have data for this.

Thanks for this helpful reply.Percentage of patients in the HSBC per severity (and ratio (HS/LS)):
Mild/moderate: 53 % (1.15)
Severe: 80 % (3.98)
Very severe: 83 % (4.86)
Granted, there are only about 2500 severe and 150 very severe patients.
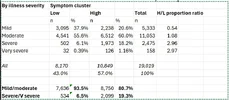
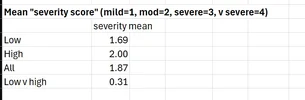

I think something might have gone wrong with you tables, or my mobile browser is really messing with how it’s being displayed.
It looks like that in my browser (Safari on an iPad) some of the data has fallen out of the tables, making them very confusing,
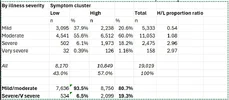
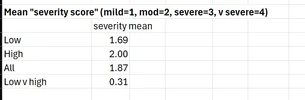
I agree the severity difference is more impressive, and that having more severe illness tends to go with more symptoms too (though I think more severe symptoms can be at least as bad as more symptoms).I agree that «symptom burden» is not ideal when talking about the number of symptoms and not the severity of symptoms. «Symptom count» like you suggest is much clearer.
My angle with my crude analysis was that you are much more likely to have a higher symptom count if you’re severe compared to being not severe. So not only do you have more severe symptoms, you also on average have a larger variety of symptoms to deal with.
I did not see it in the main text but I don’t trust me to not miss it in my current brainfogged state.Separately, did you spot a symptom count threshold derived from the k clustering - presumably there is one?
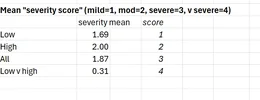
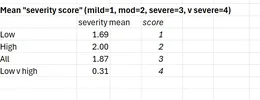
Keep in mind that high/low are relative descriptions with the entire cohort as a reference range. If you tried to determine the high/low threshold for only the severe (&vs) and then apply it to the mod (&mild) you’d get fewer of the mod in the high group.But what struck me about the paper was that the clustering threw up a 2-cluster solution, even though 80% of the high-count cluster had moderate or mild illness. Which makes it harder to interpret, at least from my perspective.
But might this not simply reflect the inability of patients with severe to very severe cases to pay attention to all sorts of milder symptoms? --in the case of what is reported is the number of symptoms and not the intensity.The stand out finding for me is that while the rate of severe and v severe illness is 3 x higher in the high symptom cluster, 80% of that still rate themselves as mild or moderate severity.