Preprint Experimental hypoxia to probe neuro-metabolic and vascular dysregulation in ME/CFS: a multimodal proof-of-concept MRI study, 2026, Bader et al.

SNT Gatchaman

Senior Member (Voting Rights)
Staff member
Experimental hypoxia to probe neuro-metabolic and vascular dysregulation in ME/CFS: a multimodal proof-of-concept MRI study
Viola Bader; Katharina Estermann; Eva Niess; Tobias Zrzavy; Florian Fischmeister; Teresa Haider; Birgit Ludwig; Frederik Barkhof; Henk Mutsaerts; Gregor Kasprian; Fabian Niess; Wolfgang Bogner; Kathrin Kollndorfer; Lukas Haider

BACKGROUND
Myalgic Encephalomyelitis/Chronic Fatigue Syndrome (ME/CFS) is a poorly understood, debilitating multisystem condition. Converging evidence implicates impaired cellular bioenergetics, neuroinflammation and defective neurovascular coupling that may manifest as "virtual hypoxia" only under physiological stress.

METHODS
We performed a single-session multimodal 3T MRI study combining brain volumetry, arterial spin labelling (ASL) and multivoxel proton magnetic resonance spectroscopy under normoxia and two controlled hypoxic challenges (oxygen saturation 87 ± 3%) in 26 ME/CFS patients and 27 age- and sex-matched healthy controls.

RESULTS
After intracranial-volume normalization, patients showed a reduced brainstem volume (1.46 0.14 vs. 1.55 ± 0.18% of eTIV; p = 0.013, FDR-p = 0.039), whereas deep grey matter and whole-brain parenchymal fraction did not differ between groups.

Whole-brain cerebral blood flow (CBF) rose under hypoxia in both groups (controls +4.8 ± 13.0%, patients +3.7 ± 11.7%), with greater initial inter-individual variability in patients (patient-to-control variance ratio up to 6.94; FDR-p = 0.001). Thalamic lactate-to-creatine (Lac/tCr) ratios increased with hypoxia in controls (FDR-p = 0.028) but were already elevated at normoxia in patients (0.171 vs. 0.135; FDR-p = 0.021) and did not rise further (FDR-p = 0.38). In exploratory analyses, patients showed exaggerated inverse coupling between thalamic total N-acetylaspartate (tNAA/tCr) and white-matter CBF.

CONCLUSIONS
These findings provide in vivo evidence of impaired neuro-metabolic and vascular adaptive capacity in ME/CFS, supporting the virtual hypoxia hypothesis and highlighting candidate imaging markers for stratification that warrant validation.

Web | DOI | PDF | Preprint: MedRxiv | Open Access
 
In the introduction they frame around evidence and hypotheses for impaired bioenergetics, and also neuroinflammation/immune activation and altered cerebrovascular control under physiological stressors. We can skip questions about the term "neuroinflammation" for this thread, having discussed elsewhere, as it's not a particular focus of the experiment and findings.

However, static measurements at rest may miss dynamic deficits in metabolic-vascular coupling that become apparent only under load. Physiologically controlled hypoxic challenges increase oxygen delivery demands and probe neurovascular reactivity (NVR) and metabolic flexibility in vivo. Advanced MRI can quantify complementary facets of brain physiology: ASL provides non-contrast CBF quantification and vascular reactivity; proton magnetic resonance spectroscopy (1H-MRSI) provides markers of oxidative and glycolytic metabolism and neuronal integrity (e.g., glutamate, glutamine, lactate, tNAA); and structural MRI assessment of regional brain atrophy, including brainstem nuclei implicated in autonomic regulation and fatigue.

So this multimodal neuroimaging approach is with a standard (high quality) clinical 3 Tesla MRI, using different MRI methods to look at:

- structure via anatomical T1-weighted imaging
- cerebral blood flow via arterial spin-labelling (ASL)
- spectroscopy for neurometabolites using 1H-MRS

For structure they hypothesise there will be evidence of regional brain atrophy, though they note heterogeneous findings in the literature: sometimes diametrically opposed in the studies we've looked at.

For function, remember we've had evidence of neurometabolic derangement via a different technique that can look at things like ATP and phosphocreatine (31P-MRS) (see thread). Also muscle (see eg thread and thread). And rewind 35 years to see the original muscle NMR spectroscopy using 31P showing prolonged phosphocreatine recovery times in exercising skeletal muscle (thread). 1H-MRS (aka proton MR spectroscopy) is the typical clinical technique we use at 3T.

For this 1H-spectroscopy, they're showing interest in:
- glutamate
- glutamine
- lactate
- creatine
- tNAA (total N-acetylaspartate)

We're familiar with glutamate/glutamine and lactate I think. Creatine and phosphocreatine are used as a buffer for ATP, which is partly made locally and partly transported in. Required for general metabolism plus calcium balance and membrane potentials. NAA is produced locally by neuronal mitochondria, dependent on cerebrovascular supply of nutrients. It's used for lipid synthesis and myelination and regarded as a marker of brain, esp. neuronal health.

The key thing here is looking at rest and under challenge. They hypothesised there would be metabolic changes for both. In particular looking for reduced metabolic flexibility under challenge. While you can put a tourniquet round the thigh to give an ischaemic challenge to skeletal muscle, you can't do that for brain, so they're trying hypoxia rather than ischaemia.

impaired reorganization of metabolic-perfusion coupling during hypoxia, consistent with reduced metabolic flexibility and virtual hypoxia.

So suspecting tissue hypoxia despite normal oxygen levels in blood. The term virtual hypoxia here I think means "functional hypoxia" but I haven't looked at their reference yet. Ie there might be a problem getting oxygen to mitochondria or the mitochondria might not be using oxygen that is supplied properly, which is something Rob Wüst's team have been looking at in skeletal muscle.

They did this multimodal study in one sitting to minimise patient burden: good. (They did also use the CFQ: bad!).

They conclude the intro with —

Establishing reproducible, quantitative stress-response signatures could accelerate biomarker development and enable mechanism-based clinical trials.

I think this is true in relation to imaging techniques. I'm biased but I'd like my specialty to be able to offer something useful although I recognise these are expensive techniques that don't scale well. A blood test would be ideal but we haven't found one yet and the problem may not (maybe ever) be adequately visible in blood, though I hope something like extracellular vesicles may come to the fore. A reliable neuroimaging marker would be a good thing, probably for muscle as well as brain. Jumping the gun a bit from their introduction, follow-on studies from here should have bigger cohorts and probably be looking at MR spectroscopy using 7T: for both 1H and 31P. I think there's more information to gain than simply "is the lactate up".
 
Last edited:
Individuals were recruited from inpatient and outpatient services at the Medical University of Vienna. The cohort comprised 26 participants with a neurologist-confirmed diagnosis of ME/CFS, aged 18-65 […] and 27 age- and sex-matched healthy controls.

They lost some participants due to various technical or protocol adherence issues, ending up with "ME/CFS: n=21 and controls: n=15".

High quality imaging equipment: Siemens 3T magnet with a 64 channel head coil. They split the study into three parts, running consecutively for around 45 mins. Structural imaging, then ASL then spectroscopy breathing normal air. Then ASL and MRS in hypoxic conditions. And a repeat of same continuing in the hypoxic conditions.

Normobaric hypoxia was induced immediately before the first hypoxic challenge by reducing the inspired oxygen fraction using a hypoxic generator, resulting in a mean peripheral oxygen saturation of 87±3% (range: 82-95%). Participants remained under hypoxic conditions throughout both hypoxic challenges (~30min) while peripheral oxygen saturation was continuously monitored

Hypoxia would affect cerebral blood flow (vasodilates), but could also increase respiratory rate and so reduce CO2, which would vasconstrict. So there could be a confounding/competing effect but their two phase acquisition over 30 minutes may be aiming to overcome that with respiration starting to acclimatise/normalise with prolonged mild hypoxia. We may need to come back to that.

For questionnaires, they did German versions of the SF-36 and CFQ but we can probably skip over those. They did some speculative correlation network analysis with those and other clinical factors vs the imaging findings, but probably numbers are too small and some questionnaires inadequate for purpose. We can come back to that later if needed.

Spectroscopic data were analysed using metabolite ratios (e.g., Lac/tCr, tNAA/tCr, Cho/tCr) extracted from white matter and thalamus regions.

So ratios here all have total creatine as the dominator. Numerators are lactate, total NAA and choline. Choline is a precursor for acetylcholine (ACh) but is also a component of phospholipids (eg phosphatidylcholine), important for membrane integrity. It's recycled with membrane turnover but needs to be supplied via blood transport to replace. (I think that vascular supply limitation might be part of vascular dementia mechanism, with impaired ACh signalling ± bad membrane function.)

Multiple-comparison correction was performed using the Benjamini–Hochberg false discovery rate (FDR) procedure, with p-values adjusted across the tested regions separately for each statistical analysis.
 
Last edited:
On to results. I'll park the structural findings on reduced brainstem volume for now, as we've seen mixed results, including bigger brainstems (eg thread). As they note in discussion —

The selective brainstem volume reduction adds to repeated evidence of brainstem structural and functional abnormality and its links to autonomic dysregulation and fatigue, although the reported direction of brainstem volume change has been inconsistent across cohorts.

Looking at spectroscopy first, this is the headline example image from fig. 2 —

MRS.webp

We're just interested in the lactate peak here, at 1.3 PPM. It's often a doublet and despite being a peak like the others it's often inverted due to technical factors on the acquisition. We might see a little bump for lactate in normal brain, though sometimes it's flat. An area of properly ischaemic brain, like an infarct will show a big lactate peak, and you also see this in primary mitochondrial diseases and in high-grade tumours.

They've mag'ed up because it's subtle, but the for the control in green on the left, the lighter green is in normoxia, the darker green is under hypoxic challenge. The "peak" reduces (ie increases, more lactate). By contrast the patient's spectra on the right overlap completely in normoxia and hypoxia (ie there's no lactate rise in response to the hypoxic challenge).

I'm uncertain whether that baseline trace for the HC's lactate is a bit too much. However, it might relate to their specific technique. But it's getting a bit late here, so I might pause with their relevant concluding remark on this —

this pattern is consistent with intrinsic mitochondrial injury or bioenergetic inefficiency, whereby the brain behaves as if it is already operating under chronic oxygen limitation.
 
Last edited:
This looks like an interesting study and design, but from what I can tell, the hypoxia didn't really make a clear difference in the results. The main finding was increased lactate, which was also present before the hypoxia and is consistent with previous findings. As the authors write:
The elevated baseline thalamic Lac/tCr is consistent with the most reproducible spectroscopic finding in ME/CFS - increased ventricular and cerebral lactate on ¹H-MRS.
 

"The aim of this study was to determine whether the DAT1VNTR polymorphism alters the metabolic ratios NAA/Cho, NAA/Cr, Cho/Cr and Ins/Cr in the left dorsolateral prefrontal cortex, anterior cingulate cortex, and putamen in healthy subjects and psychiatric patients irrespective of clinical diagnosis."

"Introduction: Dopaminergic activity in the brain is modulated by the dopamine transporter (DAT). Several lines of evidence suggest that a variable number of tandem repeats (VNTR) polymorphism of the DAT1 gene (SLC6A3) influences its gene expression. The aim of this study was to determine whether the DAT1VNTR polymorphism alters the metabolic ratios NAA/Cho, NAA/Cr, Cho/Cr and Ins/Cr in the left dorsolateral prefrontal cortex, anterior cingulate cortex, and putamen in healthy subjects and psychiatric patients irrespective of clinical diagnosis"


" Furthermore, after repeated, mild hypoxic episodes or moderate hypoxia, the increases in rat striatal extracellular dopamine and serotonin continue even during normoxia."

This is a tangent, but I couldn't help but wonder what would cause the rise in NAA, if there were any other metabolites or neurotransmitters involved.

It's interesting that "Deposition of toxic protein inclusions is a common hallmark of many neurodegenerative disorders including Alzheimer's disease, Parkinson disease etc. N-acetylaspartate (NAA) is an important brain metabolite whose levels got altered under various neurodegenerative conditions. Indeed, NAA has been a widely accepted biological marker for various neurological disorders."

 
Last edited:
"this pattern is consistent with intrinsic mitochondrial injury or bioenergetic inefficiency, whereby the brain behaves as if it is already operating under chronic oxygen limitation."

Do you have any idea why the NAA would increase?

NMDA receptors being affected?
 
@SNT Gatchaman

Not the same imaging technique, but could you comment on this potential confounder in dynamic imaging studies. Thanks.

We have a thread for that study where SNT Gatchaman posted some commentary: https://s4me.info/threads/bold-sign...across-the-human-cortex-2025-epp-et-al.47760/
 
The trace in post #6 does not show more lactate for MECFS cases so I am not sure how that fits with already being stressed into more lactate? Unfortunately I dont have time to look at this in detail ATM.
Do you mean the the people with ME/CFS did not have higher levels than the controls?
 
The trace in post #6 does not show more lactate for MECFS cases

Looks like that graph is just an example for one patient:
figure 2.c caption said:
Representative overlaid thalamic spectra acquired under normoxic baseline conditions (N) and the first hypoxic challenge (H1) from a healthy control and a ME/CFS patient in their 50’s with a disease duration of less than 5 years. The inset shows a magnified view of the lactate (Lac) resonance. Inhealthy controls, Lac/tCr increased from N to H1, whereas the elevated baseline Lac/tCr observed in the ME/CFS patient remained largely unchanged during hypoxia.
SNT seems to be saying the baseline lactate for the HC is on the high side?
I'm uncertain whether that baseline trace for the HC's lactate is a bit too much. However, it might relate to their specific technique.


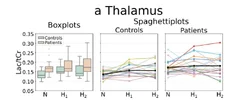
I am only skimming, but fig 5 might be more what we're after:

Screenshot 2026-08-13 at 9.28.35 AM.webp
Screenshot 2026-08-13 at 9.29.49 AM.webp

figure 5 caption said:
Thalamic and WM metabolite ratios during normoxia and hypoxia in ME/CFS patients and healthy controls. Metabolite ratios across normoxic (N) and hypoxic conditions (H1, H2) in the thalamus(a) and white matter (WM) (b) for controls and ME/CFS patients. Boxplots show group distributions of Lac/tCr, tNAA/tCr, and Cho/tCr ratios [only included Lac/tCr in screenshots above]. Spaghetti plots illustrate individual subject trajectories together with group mean trajectories for controls and patients. Metabolite ratios were normalized to totalcreatine (tCr).
 
It looks to me that patients are mostly pretty similar to controls but that there are a few oddballs that start high and paradoxically fall, giving an impression of a mean no change. The fact that you can get that degree of heterogeneity suggests to me that the data do not pick out some robust feature of MECFS.
 
So, this study uses the Lactate to Total Creatine ratio (Lac/tCr) (amongst others) as a proxy to measure a shift to a glycolysis resulting from hypoxia. An increase in lactate accompanies anaerobic metabolism and a metabolic demand exceeding oxidative phosphorylation capacity, leading to compensatory glycolysis on top of the oxidative phosphorylation cap.

They find that at rest, in the thalamus, ME patients have a mean higher increased thalamus Lac/tCr. This could mean that they are already dealing with functional hypoxic conditions and already above their oxidative phosphorylation cap with compensatory glycolysis (thus producing lactate).

Now, when exposed to the simulated hypoxic conditions, the Lac/tCr ratio increases less than healthy controls, this could mean there is a lesser capacity for additional compensatory glycolysis to be generated in further hypoxic conditions. Considering the lactate is elevated at rest, this seems sensible to me.

And on the other hand, you see the healthy controls do indeed generate a greater mean Lac/tCr increase pointing to greater capacity to upregulate glycolysis.

Now, there are two primary questions I pull from this:
  1. Why is the lactate increased specifically in the thalamus? The paper states “Metabolite levels in two regions of interest (ROIs) were analysed: white matter (WM)- dominated regions and the thalamus”. What about the rest of the brain? We cannot say how specific to the thalamus these metabolite alterations indicative of compensatory glycolysis are without knowing what the “regions of interest” are and which ones were/were not analyzed.
  2. Is there an issue of oxygen availability or uptake? In general, issues surrounding oxygen getting to where it needs to go and doing its job has been a question since Cheney, observed in many different fashions, but yet this question has still not yet been answered. As the study states, arterial oxygenation is high but if there are problems at the microvascular level or if the impairment comes mitochondria-side and throughput of oxygen is limited due to mitochondrial bottlenecks. Moreau’s suggestion of AG-348 fits or the use of xanomeline (in this study here) fit into an argument for RBC-side dynamics. It is also possible for both to be simultaneously occurring at different layers.
 
Now, when exposed to the simulated hypoxic conditions, the Lac/tCr ratio increases less than healthy controls, this could mean there is a lesser capacity for additional compensatory glycolysis to be generated in further hypoxic conditions. Considering the lactate is elevated at rest, this seems sensible to me.

But is this consistent with the data? Looking at the linear plots over time most of the ME/CFS cases behave the same as normal. The higher mean level to start with appears to be due to one or two cases with unusually high ratios. But the weird thing is that in these people the ration plummets with the hypoxic stress. So there is nothing to indicate a ceiling effect. Rather, there appears to be a paradoxical effect in a few cases - and that fall makes the whole idea of marginal hypoxia seem untenable since a hypoxic stress should have made it worse.
 
Back
Top Bottom