DecodeME candidate ME/CFS gene
********************
FBXL4 (Tier 2)
• Protein: F-box/LRR-repeat protein 4. UniProt. GeneCards.
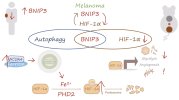
• Molecular function: Component of the mitochondria-localised SCF-FBXL4 ubiquitin E3 ligase complex. This complex restricts mitophagy by controlling the degradation of BNIP3 and NIX mitophagy receptors (26,27).
• Cellular function: Regulator of mitophagy.
• Link to disease: Mutations in FBXL4 can cause mitochondrial DNA depletion syndrome caused by elevated mitophagy (28).
• Potential relevance to ME/CFS: Reduction in FBXL4 function is associated with impaired mitochondrial respiratory chain deficiency, which has been reported in a sample of people with ME/CFS (29). Lymphoblasts from people with ME/CFS in one study, however, have not been observed to be depleted in mitochondrial DNA (30).
********************
Reference 26
Nguyen-Dien GT, Townsend B, Kulkarni PG, Kozul KL, Ooi SS, Eldershaw DN, et al. PPTC7 antagonizes mitophagy by promoting BNIP3 and NIX degradation via SCFFBXL4. EMBO Rep. 2024 Aug;25(8):3324–47.
Reference 27
Cao Y, Zheng J, Wan H, Sun Y, Fu S, Liu S, et al. A mitochondrial SCF-FBXL4 ubiquitin E3 ligase complex degrades BNIP3 and NIX to restrain mitophagy and prevent mitochondrial disease. EMBO J. 2023 Jul 3;42(13):e113033.
Reference 28
Bonnen PE, Yarham JW, Besse A, Wu P, Faqeih EA, Al-Asmari AM, et al. Mutations in FBXL4 cause mitochondrial encephalopathy and a disorder of mitochondrial DNA maintenance. Am J Hum Genet. 2013 Sep 5;93(3):471–81.
Reference 29
Tomas C, Brown A, Strassheim V, Elson JL, Newton J, Manning P. Cellular bioenergetics is impaired in patients with chronic fatigue syndrome. PLoS One. 2017;12(10):e0186802.
Reference 30
Missailidis D, Annesley SJ, Allan CY, Sanislav O, Lidbury BA, Lewis DP, et al. An Isolated Complex V Inefficiency and Dysregulated Mitochondrial Function in Immortalized Lymphocytes from ME/CFS Patients. Int J Mol Sci. 2020 Feb 6;21(3).
In DecodeME, we attempted to link GWAS variants to target genes. Here we discuss the top two tiers of predicted linked genes that we are most confident about –‘Tier 1’ and ’Tier 2’.
We defined genes as Tier 1 genes if: (i) they are protein-coding genes, (ii) they have GTEx-v10 expression quantitative trait loci (eQTLs) lying within one of the FUMA-defined ME/CFS-associated intervals, and (iii) their expression and ME/CFS risk are predicted to share a single causal variant with a posterior probability for colocalisation (H4) of at least 75%. For this definition, we disregarded the histone genes in the chr6p22.2 HIST1 cluster, as their sequences and functions are highly redundant (1). This prioritisation step yielded 29 Tier 1 genes.
For the intervals without Tier 1 genes, three Tier 2 genes were defined as the closest protein-coding genes without eQTL association: FBXL4 (chr6q16.1), OLFM4 (chr13q14.3), and CCPG1 (chr15q21.3).
CHROMOSOME 6q
Chr6q contained no Tier 1 genes, but one Tier 2 gene.
The interval also contains a non-protein long noncoding RNA locus (RP11-436D23.1) (25) which contains a miRNA locus (miR-2113) of unknown function. The allele that increases the risk of ME/CFS is associated with increasing RP11-436D23.1 expression in four tissues: amygdala, anterior cingulate cortex, cortex and hippocampus.
********************
FBXL4 (Tier 2)
• Protein: F-box/LRR-repeat protein 4. UniProt. GeneCards.
• Molecular function: Component of the mitochondria-localised SCF-FBXL4 ubiquitin E3 ligase complex. This complex restricts mitophagy by controlling the degradation of BNIP3 and NIX mitophagy receptors (26,27).
• Cellular function: Regulator of mitophagy.
• Link to disease: Mutations in FBXL4 can cause mitochondrial DNA depletion syndrome caused by elevated mitophagy (28).
• Potential relevance to ME/CFS: Reduction in FBXL4 function is associated with impaired mitochondrial respiratory chain deficiency, which has been reported in a sample of people with ME/CFS (29). Lymphoblasts from people with ME/CFS in one study, however, have not been observed to be depleted in mitochondrial DNA (30).
********************
Reference 26
Nguyen-Dien GT, Townsend B, Kulkarni PG, Kozul KL, Ooi SS, Eldershaw DN, et al. PPTC7 antagonizes mitophagy by promoting BNIP3 and NIX degradation via SCFFBXL4. EMBO Rep. 2024 Aug;25(8):3324–47.
Reference 27
Cao Y, Zheng J, Wan H, Sun Y, Fu S, Liu S, et al. A mitochondrial SCF-FBXL4 ubiquitin E3 ligase complex degrades BNIP3 and NIX to restrain mitophagy and prevent mitochondrial disease. EMBO J. 2023 Jul 3;42(13):e113033.
Reference 28
Bonnen PE, Yarham JW, Besse A, Wu P, Faqeih EA, Al-Asmari AM, et al. Mutations in FBXL4 cause mitochondrial encephalopathy and a disorder of mitochondrial DNA maintenance. Am J Hum Genet. 2013 Sep 5;93(3):471–81.
Reference 29
Tomas C, Brown A, Strassheim V, Elson JL, Newton J, Manning P. Cellular bioenergetics is impaired in patients with chronic fatigue syndrome. PLoS One. 2017;12(10):e0186802.
Reference 30
Missailidis D, Annesley SJ, Allan CY, Sanislav O, Lidbury BA, Lewis DP, et al. An Isolated Complex V Inefficiency and Dysregulated Mitochondrial Function in Immortalized Lymphocytes from ME/CFS Patients. Int J Mol Sci. 2020 Feb 6;21(3).


