

ME/CFS Science Blog
Senior Member (Voting Rights)
Another locus that was just below the significance threshold (p = 6.3 × 10⁻⁷) in DecodeME. The A risk allele of the top hit was present in 29.6% of chromosomes in cases, 28.0% in controls.
The signal seems to point to the gene MLLT10 as most of the credible set lies inside it.
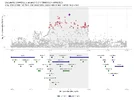
Some of it lies inside DNAJC1 but looking at the Hi-C data and 3D folding, it lies at the edge or outside the domains. It also had less loops in the ENCODE data. Both show the regions that often touch and are connected. FLAMES also think the signal points to MLLT10

In the eqtl data there were some good matches for the non-coding RNA MIR1915HG
But then in the phewas there were so many other GWAS traits that almost perfectly colocalized here. It's hard to make sense out of all of these. It made me a bit skeptical about the signal: perhaps it suggests that it's driven by some selection bias in the UK biobank cohort?
The signal seems to point to the gene MLLT10 as most of the credible set lies inside it.
Some of it lies inside DNAJC1 but looking at the Hi-C data and 3D folding, it lies at the edge or outside the domains. It also had less loops in the ENCODE data. Both show the regions that often touch and are connected. FLAMES also think the signal points to MLLT10
In the eqtl data there were some good matches for the non-coding RNA MIR1915HG
| Trait (gene) | Study | PP.H4 | lead_p | risk_allele |
| MIR1915HG | GTEx_v10 | brain (cerebellum) | naive | QTD000166 | 0.96 | 7.4e-10 | raises (z = 5.7) |
| MLLT10 | GTEx_v10 | thyroid | naive | QTD000341 | 0.93 | 4.3e-06 | raises (z = 4.6) |
| MIR1915HG | GTEx_v10 | brain (cerebellum) | naive | QTD000161 | 0.93 | 1.8e-08 | raises (z = 5.2) |
| MIR1915HG | GTEx_v10 | artery (tibial) | naive | QTD000141 | 0.91 | 8.8e-08 | raises (z = 4.2) |
| MIR1915HG | GTEx_v10 | esophagus (muscularis) | naive | QTD000246 | 0.90 | 2.8e-06 | raises (z = 4.0) |
| MLLT10 [ILMN_1743538] | Fairfax_2014 | monocyte | naive | QTD000081 | 0.85 | 4.8e-07 | raises (z = 4.5) |
| MLLT10 | Cytoimmgen_reannotated | CD4+ TCM cell | naive_16H | QTD000914 | 0.70 | 7.3e-06 | lowers (z = -4.3) |
| MIR1915HG | GTEx_v10 | adipose | naive | QTD000116 | 0.66 | 1.4e-05 | raises (z = 3.3) |
| MLLT10 | Alasoo_2018 | macrophage | IFNg_18h+Salmonella_5h | QTD000016 | 0.64 | 3.8e-06 | lowers (z = -3.9) |
| MIR1915HG | GTEx_v10 | artery (aorta) | naive | QTD000131 | 0.60 | 2.1e-06 | raises (z = 3.2) |
But then in the phewas there were so many other GWAS traits that almost perfectly colocalized here. It's hard to make sense out of all of these. It made me a bit skeptical about the signal: perhaps it suggests that it's driven by some selection bias in the UK biobank cohort?
| Trait | PP.H4 | lead_p | study_ID | Source |
| Fresh fruit consumption | 0.99 | 2.9e-24 | ebi-a-GCST90096912 | OpenGWAS |
| Body fat percentage (UKB data field 23099) | 0.99 | 8.3e-24 | ebi-a-GCST90013975 | OpenGWAS |
| Waist circumference (UKB data field 48) | 0.98 | 1.9e-24 | ebi-a-GCST90014020 | OpenGWAS |
| Salad consumption | 0.98 | 6.7e-16 | ebi-a-GCST90096923 | OpenGWAS |
| Monocyte count | 0.97 | 3.0e-11 | ebi-a-GCST90018967 | OpenGWAS |
| White blood cell count (monocyte) | 0.97 | 5.0e-12 | ebi-a-GCST90028998 | OpenGWAS |
| Medication for pain relief constipation heartburn: Paracetamol | 0.97 | 4.5e-08 | ukb-a-455 | OpenGWAS |
| Monocyte count | 0.97 | 4.4e-11 | ukb-d-30130_irnt | OpenGWAS |
| Leg fat percentage (right) | 0.97 | 1.6e-22 | ukb-a-274 | OpenGWAS |
| Salad / raw vegetable intake | 0.97 | 1.4e-12 | ukb-b-1996 | OpenGWAS |
| Lung function (FVC) | 0.96 | 1.1e-08 | ebi-a-GCST007429 | OpenGWAS |
| Adult BMI females | 0.95 | 1.2e-14 | ieu-b-5117 | OpenGWAS |
| Weight | 0.95 | 1.2e-15 | ukb-a-249 | OpenGWAS |
| Qualifications: College or University degree | 0.95 | 2.5e-07 | ukb-a-397 | OpenGWAS |
| Lung function (FVC) | 0.95 | 7.9e-11 | ebi-a-GCST90029027 | OpenGWAS |
| IDP dMRI ProbtrackX MO str l | 0.95 | 5.9e-07 | ubm-a-705 | OpenGWAS |
| Qualifications: College or University degree | 0.94 | 1.7e-08 | ukb-b-16489 | OpenGWAS |
| Physical activity (Total log acceleration 8am-10am) | 0.94 | 1.8e-09 | ebi-a-GCST90061413 | OpenGWAS |
| Hip circumference (UKB data field 49) | 0.94 | 3.5e-21 | ebi-a-GCST90014021 | OpenGWAS |
| IDP_dMRI_TBSS_ISOVF_Superior_fronto-occipital_fasciculus_L | 0.94 | 9.9e-07 | ubm-b-2095 | OpenGWAS |