HERV activation segregates ME/CFS from fibromyalgia while defining a novel nosologic entity, 2025, Gimenez-Orenga, Oltra

Screenshot 2026-09-07 at 4.09.51 PM.webp

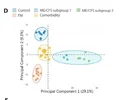
It is suggested that the analysis finds that the 4 groups are cleanly differentiated by the HERV parameters. Unfortunately, I think this looks like yet another misuse of Principal Component Analysis by ME/CFS research teams.

Basically, the arrays assessed over 1 million features. Then, only 489 features were used in the Principal Component Analysis - the 489 parameters that most differentiated the groups from each other. Unsurprisingly, the PCA suggests that the 4 groups differ from each other.

We need our researchers to recognise the problem and stop doing this.

Genome-wide HERV expression profiles for each of the four study groups (three disease groups: ME/CFS, FM, and their comorbidity, plus one control group corresponding to healthy participants), using custom high-density Affymetrix HERV-V3 microarrays (39), showed that a set of 489 HERV (502 probesets) is differentially expressed (DE) between at least two of the groups (FDR<0.1 and |Log2FC|>1)(Fig. 1; Table S2), confirming dysregulation of particular sets of HERV elements in the immune systems of ME/CFS, FM, and comorbidity as compared to healthy controls.
No, this analysis really does not confirm dysregulation. We could randomly assign the participants to 4 completely mixed up groups, and we could still produce a PCA like the one above, suggesting that our new groups are differentiated.

In line with our findings, unsupervised principal component analysis (PCA) of DE HERV loci supports perfect discrimination of samples by study group and differentiates the two identified

Transcriptome analysis by microarray. HERV transcriptome was scrutinized using custom high-density HERV-V3 microarrays, capable to discriminate 174,852 HERV elements, 179,142 MaLR elements, and putative active 1,072 LINE-1 elements at the locus level, in addition to detecting a set of 1,559 genes involved in eight potentially relevant cellular pathways (immunity, inflammation, cancer, central nervous system affections, differentiation, telomere maintenance, chromatin structure, and gag-like genes).

Overall, 1,397,352 probes were detected, the vast majority of them corresponding to HERV (1,290,800 probesets), followed by genes (103,724 probesets), and LINE-1 (2,828 probesets).

Identification of differentially expressed HERV and genes. All bioinformatic analysis were performed with RStudio software version 4.2.1. Microarray CEL files were processed and analyzed using R oligo package (87). Data were normalized, adjusted for background noise, and summarized using the RMA (Robust Multi-Array) algorithm. Differential expression (DE) analysis was performed using limma R package (88), considering differentially expressed those probes with a “Benjamin-Hochberg” (BH) adjusted p value<0.1 and an absolute log2 fold-change>1.ME/CFS subgroups (Fig. 1D).
 
Last edited:
The thing is, it is possible that the features that differentiate the (small) groups actually are related to ME/CFS. It's also possible that they are just completely random differences.

If there was another sample, a decent sized sample, and the same features again differentiated the group, then maybe there is something. Until then, we can't know.

I find the idea of this, that these HERVs, that presumably can do useful things for the human body, can also do harmful things if somehow "reactivated" or changed by a viral infection or some other stressor appealing. But, this is not proof that it is causing ME/CFS.
 
Screenshot 2026-09-07 at 5.08.41 PM.webp
Here are what are presumably the most compelling groups of features associated with the HERVs. For most of them, the controls overlap a lot. But there are a few where the controls do look different.

(I haven't quite got my head around how all those thousands of features relate to each other. If a number of features are associated with one HERV, then all of the features are not independent of each other. I haven't delved into it all, and I'm probably going to need to take a break now. )

I don't think it would be that hard to confirm or deny these findings. There just needs to be a replication of the study with larger groups.
 
Basically, the arrays assessed over 1 million features. Then, only 489 features were used in the Principal Component Analysis - the 489 parameters that most differentiated the groups from each other. Unsurprisingly, the PCA suggests that the 4 groups differ from each other.
Could you explain what’s problematic with this approach?

What’s the difference between using only a subset of the features and using the entire set?
 
What’s the difference between using only a subset of the features and using the entire set?
From a pool of more than 1 000 000 features, the authors select 489 that vary significantly between groups (Benjamini–Hochberg adjusted p-values).
The subsequent PCA analysis in the figure in post #21 looks impressive, but doesn't really add extra evidence: it's not very remarkable that after some linear algebra those 489 data points still vary significantly between groups,

Do correct me if I'm wrong or incomplete.

P.S. Typing out the numbers above I wonder how reliable the selection of 489 out of a million features is if there are only 43 participants?
 
P.S. Typing out the numbers above I wonder how reliable the selection of 489 out of a million features is if there are only 43 participants?
I think it's probably fine. Problems with large feature/sample ratios are common. Appropriate statistical treatment seems to be well established based on a quick search.
 
Back
Top Bottom