Thesis Hypothalamic Dysfunction and Neurotransmitter Abnormalities in the Postviral Fatigue Syndrome, 1992, Bakheit

forestglip

Administrator
Staff member
Hypothalamic Dysfunction and Neurotransmitter Abnormalities in the Postviral Fatigue Syndrome

Abdel Magid Osman Bakheit

Thesis supervisor: Peter O. Behan

A thesis submitted for the degree of Doctor of Medicine (MD) of the University of Glasgow


Final paragraph
In conclusion, the studies discussed in this thesis demonstrate subtle abnormalities of hypothalamic function and upregulation of hypothalamic 5-HT receptors in patients with PVFS. Taken together with the evidence that enterovirus persistence has been established In the muscle of patients with this disorder, and that persistent viruses can interfere with cell function without causing cell death, we postulate that the neuroendocrine and 5-HT abnormalities reported here are due to viral persistence in hypothalamic neurones. We are at present attempting to establish an animal model of persistent enteroviral infection in the nervous system, to test this hypothesis.

Web | PDF | Thesis | Open Access
 
This is the thesis that was the first (that I know of) to report an increased prolactin response in an ME/CFS-like trait. It includes the same study as this published paper:


The prolactin data from this study has been discussed on the prolactin response thread.

The thesis says that 5 total publications resulted from this work:
1. Behan P O , Bakheit AMO. Clinical spectrum of postviral fatigue syndrome. British Medical Bulletin 1991, 47: 793-808

2. Bakheit AMO, Behan WMH, Gow J, Behan PO. Persistent enteroviruses and abnormal hypothalamic and neurotransmitter function in postviral fatigue syndrome (abstract). Annals of Neurology 1991, 30: 315

3. Bakheit AMO, Behan PO, Dinan TG, Gray CE, O'Keane V. Possible upregulation of hypothalamic 5-HT receptors in patients with the postviral fatigue syndrome. British Medical Journal 1991, 304: 1010-1012

4. Smith AP, Behan PO, Bell W, Millar K, Bakheit M. Behavioural problems associated with the chronic fatigue syndrome. British Journal of Psychology (in press)

5. Bakheit AMO, Behan P0, Watson WS, Morton JJ. Abnormal arginine vasopressin secretion and water metabolism in Paitents w ith postviral. fatigue syndrome . Acta Neurologies Scandinavian (in press)

I wanted to make a thread just for this thesis to add a few notes and not clutter the prolactin response thread.
 
Mainly I just wanted to note down that there seem to be some data entry or transcription errors for the prolactin raw data for a few individuals. It probably isn't likely to change the results, especially as 3 other studies have reported the same finding of increased prolactin-response after buspirone (and one case study). But I thought it was worth just having it logged somewhere.

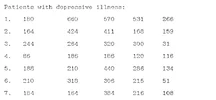
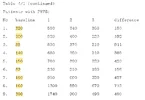
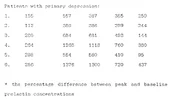
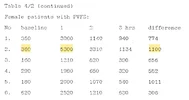
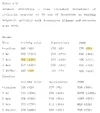
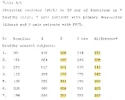
Here is the raw data from the thesis for prolactin level at each time point for each individual. I added the highlighting for the numbers where I noticed some possible discrepancies:

Male/healthy
1785268130731.webp

Male/depression
1785268164882.webp

Male/postviral fatigue syndrome (PVFS)
1785268196516.webp

Female/healthy
1785268227433.webp

Female/depression
1785268248067.webp

Female/PVFS
1785268270751.webp

Summary statistics (mean and standard deviation for each group at each time point)
1785268303118.webp

For % difference, the definition given is:
The response to buspirone was determined by subtracting baseline from peak prolactin levels and the latter value was expressed as a percentage of baseline prolactin.


Possible data discrepancies:

1. When I calculate the mean and standard deviation (STD) of healthy males at 2 hours, mean and STD do not match the reported summary statistics.
  • The individual prolactin values for healthy males at 2 hours are: 186, 492, 501, 473, 310, 456, 290
  • From those values, I calculated mean = 386.9 and STD = 123.8.
  • The thesis reports that mean = 401 and STD = 116
2. When I calculate the STD of % difference (% increase from baseline value to maximum prolactin value) for healthy males, STD does not match the reported summary statistics.
  • The individual % difference values for healthy males are: 121, 225, 141, 342, 100, 109, 102
  • From these values, I calculated mean = 162.9 and STD = 90.1
  • The thesis reports that mean = 163 and STD = 49
3. When I calculate the mean and STD of PVFS males at baseline, STD does not match the reported summary statistics.
  • The individual prolactin values for PVFS males at baseline are: 220, 280, 88, 140, 150, 89, 180, 160, 300
  • From these values, I calculated mean = 178.6 and STD = 75.5
  • The thesis reports that mean = 178 and STD = 65
4. When I calculate the % increase for participant 2 in the female PVFS group, it does not match the reported % difference.
  • The values for this individual are: Baseline: 360, 1 hour: 5300, 2 hours: 3310, 3 hours: 1134.
  • Using the provided definition of % difference: (max value - baseline) / baseline = (5300 - 360) / 360 = 13.72 = 1372%
  • The paper reports a % difference of 1100% for this individual.


It was probably just some accidental transcription errors that only affected a small number of data points. For the rest of the participants/groups, within differences in rounding, the group summary statistics match what is expected from the raw data, and the % difference for each individual matches what is expected from their time point values.
 
I thought it'd be nice to visualize the data on an individual level, so I plotted the raw values. Male is the top row, female is the bottom row.

bakheit_prolactin_individual.webp

There's an unmistakable difference here. It's consistent between sexes, and for the females, there's virtually zero overlap at all of PVFS with the other groups (healthy and depression).

Of course, that doesn't mean it's definitely pointing to something interesting, but it's clearly statistically significant.
 
Though I'm curious why the difference is so stark here, but in Tahir Majeed's thesis for a very similar study, the difference was not quite so obvious.

Here is that other thesis: Neuroendocrine Alterations in Chronic Fatigue Syndrome (Majeed, 1996)

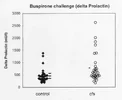
The only individual data for Majeed's thesis for prolactin response to buspirone is in the form of this plot which shows absolute difference in prolactin between baseline and peak for each individual:
1785271076090.webp

Figure 4.1.1 Prolactin (PRL) responses (A prolactin) to buspirone challenge in chronic fatigue syndrome (CFS) - O - and in healthy controls - ♦ -. Results are expressed as the mean ± SEM with 95% confidence limit in control subjects to compare with mean ± SEM (-) of CFS group.

The CFS group did have a statistically significantly higher change in prolactin than the healthy control group, but there is a large amount of overlap.
Δ Prolactin levels differed significantly between patients with chronic fatigue syndrome and controls (unpaired t-test: t = 2.7, d .f= 58, P < .009) (see fig. 4.1.1).

To compare, I calculated delta for each individual for the 1992 Bakheit thesis the same way, and plotted:

A little bit of overlap for males and almost no overlap for females.
 
Last edited:
I already posted Bakheit 1992's inclusion criteria for the PVFS group on the prolactin response thread, where I noted that all participants had to have fatigue made worse by exercise and not improved by rest, but adding it here too:
[p. 76] The following criteria were used in making the diagnosis of PVFS:

1) the symptoms of PVFS were preceded by an acute viral illness in all patients .

2) all patients had fatigue for at least six months and the level of fatigue was such that it reduced the patient's premorbid level of activity by 50% or more. The fatigue in these patients is made worse by exercise and is not affected by bed rest

3) in addition to the typical chronic fatigue, patients had three or more of the following symptoms: myalgia, sleep disturbances (insomnia, excessive sleep or reversed sleep pattern), depression, excessive sweating, constipation alternating with diarrhoea, palpitations and unsteadiness, menstrual irregularities and minor fluctuations in body temperature.

4) lack of co-morbidity: none of the patients had clinical or laboratory evidence of chronic illnesses , e.g. infection, malignancy, auto-immune disease, metabolic or endocrine disturbances.

5) none of the patients had a past or family history of a major psychiatric illness and all patients had a good work record and a well-adjusted premorbid personality as shown by the patients' previous ability to cope with everyday life stress.

In addition to these strict diagnostic criteria, an objective confirmation of the organicity of the patients' illness was sought. All patients but one had a needle muscle biopsy from the vastus lateralis of the quadriceps femoris muscle. The biopsy was processed for routine and electron microscopy and also for detection of genomic RNA sequences using the polymerase chain reaction.

I was thinking it might be the requirement for PEM that is the reason the difference was so stark in this study. But it looks like Majeed's 1996 study also required that fatigue was "made worse by exercise". Criteria from the Majeed 1996 thesis:
Patients included in the studies of this thesis fulfilled the following criteria:

1. Acute onset of fatigue, which was severe enough to prevent them continuing in their occupation, prevented women from carrying out their household duties and dramatically altered their social and personal lives. It fluctuated with time and was made worse by exercise.

2. At least two of the following four were present:
​
a. Sleep disturbance (hypersomnia or insomnia).​
​
b. Myalgia/arthralgia.​
​
c. Neurobehavioural complaints (inability to concentrate, difficulty thinking, forgetfulness, anomia, atypical depression, generalised headaches).​
​
d. Symptoms of irritable bowel syndrome- bloated stomach, colicky abdominal pain, alternating diarrhoea or constipation.​
​
3. Patients with complaints of excessive sweating, chest pains, palpitations, dysequilibrium and recurrent infections were also included but this was not mandatory for inclusion into the studies.

4 Patients who were excluded from the studies included:
​
a. Patients with established medical conditions known to cause chronic fatigue.​
​
b. Patients with a current diagnosis of schizophrenia, manic depressive psychosis or substance abuse.​

In addition, all the patients incuded were seen at the Institute of Neurological Sciences and were hospitalized as inpatients.
All patients were selected according to the criteria outlined in the introduction of this thesis and they also fulfilled the CDC criteria laid down by Fakuda et al in 1994. Those with co-existing depression were excluded. Essentially, patients meeting the CDC criteria had to have persisting or relapsing, debilitating fatigue for at least six months in the absence of any medical diagnosis which would explain the syndrome. Laboratory tests which include ESR, complete blood count and differential, protein electrophoresis, serum electrolytes, glucose, creatinine, blood urea, serum calcium and phosphate, liver function tests, muscle enzymes, urinalysis, chest x-rays, thyroid function tests, antinuclear antibodies screen were carried out to exclude any other medical cause for their fatigue.
 
Last edited:
Those 6 top samples are doing a lot of the work for Majeed’s difference.
Yeah, exactly.

I wonder if the difference might be the post-viral requirement for the Bakheit study ("preceded by an acute viral illness in all patients"). The Majeed study required acute onset, but doesn't mention requiring infection.
 
Majeed says on the page before the prolactin response graph that the data resulted in a p < 0.009. Is that plausible?

Also looking at the graph over time of the data (fig. 4.1.2):
Screenshot 2026-07-28 at 2.57.52 PM.webp

I'm confused how to square the curve for the controls with the change in prolactin plot (fig. 4.1.1). I would have guessed from the curve in 4.1.2 that most controls had a prolactin delta around 200-300, but the median in 4.1.1 looks closer to 500. Maybe it's mathematically possible and just unintuitive, but I am a bit puzzled.
 
I wonder if the difference might be the post-viral requirement for the Bakheit study ("preceded by an acute viral illness in all patients"). The Majeed study required acute onset, but doesn't mention requiring infection.
Looks like Sharpe 1996 used Oxford, which requires a "definite onset" but not necessarily acute viral illness from what I'm reading. Sharpe was the one where patients had higher prolactin levels at 1h, but their (overall peak prolactin) - (baseline prolactin) was not statistically significantly different from controls (it was trending higher). So maybe?
 
Majeed says on the page before the prolactin response graph that the data resulted in a p < 0.009. Is that plausible?
Yes, it seems to be possible. I did my best to pick out the value of each point from the image using Webplot Digitizer. I had to guess an approximate location for a few within the middle of the crowded areas:
1785278449954.webp

Here's my replotting of the values I identified:
1785279653145.webp
CFS:

170.567649686278
240.263573286391
284.795916485057
346.317431622997
375.125501677308
457.280678407387
434.611320317173
2626.96948695178
2009.79374244025
1842.21836896571
1709.3842314554
1372.3559003576
1382.24978061912
996.174998748277
842.904840082534
750.71348197651
730.506723727657
681.673724626262
583.786369134361
644.699151727245
664.913815593567
578.876980686576
554.970393462581
513.71888151324
460.142511930894
448.086445291809
378.793708182578
460.980507382529
485.187508070318
436.204302237026

Control:

1384.45940070149
1270.01768223107
983.905480437549
667.162963763285
591.549685488185
536.174787931811
505.813264044988
480.570627468858
460.3401523676
444.204787114898
428.077327479663
444.60006798831
448.924440743444
475.688908682212
357.167891598173
330.387612424468
191.225028130822
232.12869291156
330.142538282953
334.040007694801
337.921665871712
325.454507124279
349.787997691559
190.7823135526
231.638544628528
219.566666754507
256.351504834285
281.064465040042
284.819633337461
309.437726133599

When I do a t-test, I got p=.0086, which, after rounding, is exactly what the thesis says. So surprisingly, my points are fairly accurate. Looking at the plot, it does seem like it's more than just based on the high outliers, and the lower areas are also shifted up somewhat.

Even more surprisingly, the p-value is even smaller when doing a Mann-Whitney test (p=.0020). I thought it wouldn't be as significant if not giving those outliers a lot of weight like a t-test does.

Also looking at the graph over time of the data (fig. 4.1.2):
Screenshot 2026-07-28 at 2.57.52 PM.webp


I'm confused how to square the curve for the controls with the change in prolactin plot (fig. 4.1.1). I would have guessed from the curve in 4.1.2 that most controls had a prolactin delta around 200-300, but the median in 4.1.1 looks closer to 500. Maybe it's mathematically possible and just unintuitive, but I am a bit puzzled.
I think it can be possible.

Lets say at 60 minutes, five of the participants had an average difference from baseline of 500 and five had a difference of 100. And same thing for 120 minutes, but where the participants swap (those with a high difference at 60 minutes have a low difference at 120 minutes, and vice versa).

So for both timepoints, it'll average 100 and 500 to get an increase of 250, which is how high the plot would be at each timepoint.

But for the delta prolactin plot, it uses whatever timepoint each individual had their peak at. Meaning it would use the five individuals' delta of 500 at 60 minutes and five individuals' delta of 500 at 120 minutes, averaging them out to get 500.

Edit: Fixed the scale of the data in my plot and dataset.
 
Last edited:
It occurred to me that the Majeed plot includes both males and females (15 of each for ME/CFS and same for controls).

If combining males and females together in the Bakheit plot, it might look fairly similar. The abnormal response in males with PVFS is about the same magnitude as healthy response in females.

So good idea to analyze males and females separately to most clearly see the differences. The Majeed finding might have looked a lot more impressive if they had plotted the sexes separately.
 
Last edited:
So good idea to analyze males and females separately to most clearly see the differences. The Majeed finding might have looked a lot more impressive if they had plotted the sexes separately
Good observation. A future study, whether with buspirone or another drug, should definitely do this. Controlling for menstrual phase is also important.

What would be best above all would be to have individual de-indentified data so these differences can be verified. Plus, it means the cool graph people here can have fun making some and matching the axes to past studies for comparison.
 
I calculated an effect size (Hedges g) using the data in the thesis.

Males
Using prolactin values after 1 hour
-1.38 [-2.42, -0.30]
Using prolactin difference between baseline and 1 hour
- 1.45 [-2.51, -0.36]

Females
Using prolactin values after 1 hour
-1.71 [-2.96, -0.40]
Using prolactin difference between baseline and 1 hour
-1.66 [-2.90, -0.36]

So very big effect sizes but because of the high variance and small sample sizes, the confidence intervals are very wide.
 
Yes, it seems to be possible. I did my best to pick out the value of each point from the image using Webplot Digitizer. I had to guess an approximate location for a few within the middle of the crowded areas:
View attachment 33476

Here's my replotting of the values I identified:
View attachment 33478
CFS:

170.567649686278
240.263573286391
284.795916485057
346.317431622997
375.125501677308
457.280678407387
434.611320317173
2626.96948695178
2009.79374244025
1842.21836896571
1709.3842314554
1372.3559003576
1382.24978061912
996.174998748277
842.904840082534
750.71348197651
730.506723727657
681.673724626262
583.786369134361
644.699151727245
664.913815593567
578.876980686576
554.970393462581
513.71888151324
460.142511930894
448.086445291809
378.793708182578
460.980507382529
485.187508070318
436.204302237026

Control:

1384.45940070149
1270.01768223107
983.905480437549
667.162963763285
591.549685488185
536.174787931811
505.813264044988
480.570627468858
460.3401523676
444.204787114898
428.077327479663
444.60006798831
448.924440743444
475.688908682212
357.167891598173
330.387612424468
191.225028130822
232.12869291156
330.142538282953
334.040007694801
337.921665871712
325.454507124279
349.787997691559
190.7823135526
231.638544628528
219.566666754507
256.351504834285
281.064465040042
284.819633337461
309.437726133599

When I do a t-test, I got p=.0086, which, after rounding, is exactly what the thesis says. So surprisingly, my points are fairly accurate. Looking at the plot, it does seem like it's more than just based on the high outliers, and the lower areas are also shifted up somewhat.

Even more surprisingly, the p-value is even smaller when doing a Mann-Whitney test (p=.0020). I thought it wouldn't be as significant if not giving those outliers a lot of weight like a t-test does.


I think it can be possible.

Lets say at 60 minutes, five of the participants had an average difference from baseline of 500 and five had a difference of 100. And same thing for 120 minutes, but where the participants swap (those with a high difference at 60 minutes have a low difference at 120 minutes, and vice versa).

So for both timepoints, it'll average 100 and 500 to get an increase of 250, which is how high the plot would be at each timepoint.

But for the delta prolactin plot, it uses whatever timepoint each individual had their peak at. Meaning it would use the five individuals' delta of 500 at 60 minutes and five individuals' delta of 500 at 120 minutes, averaging them out to get 500.

Edit: Fixed the scale of the data in my plot and dataset.

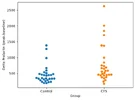
I'm curious what this would look like with a boxplot, or maybe violin? The outliers from the CFS group are so high they kind of squeeze all the other results close together at the bottom, making it kind of look like the two groups are the same except for the outliers, but I think the effect is a little bigger than it seems, as I guess the p value implies.
 
I'm curious what this would look like with a boxplot, or maybe violin?
Good idea. Here's a box plot:

1787751476897.webp
It does seem like the control group has a glob of points at the very bottom that the CFS group does not have.

I made a violin plot as well with default seaborn settings, though I don't consider these very easy to interpret. For example, this gives the impression of a cluster of points in the CFS group that are lower than anyone in the control group, but that's not what the plot of individual points looks like to me.
1787750628847.webp

One more, with values rounded to the nearest 100:
1787750763433.webp

Just noting again that these values were from the paper's plot, and some might not closely match participant values. But they're probably pretty close, since the t-test p-value was the same.
 
Last edited:
Good idea. Here's a box plot:

View attachment 33916
It does seem like the control group has a glob of points at the very bottom that the CFS group does not have.

I made a violin plot as well with default seaborn settings, though I don't consider these very easy to interpret. For example, this gives the impression of a cluster of points in the CFS group that are lower than anyone in the control group, but that's not what the plot of individual points looks like to me.
View attachment 33910

One more, with values rounded to the nearest 100:
View attachment 33911

Just noting again that these values were from the paper's plot, and some might not closely match participant values. But they're probably pretty close, since the t-test p-value was the same.

Really interesting thanks! Are these two studies fukuda?
 
Were participants in these studies on any psychiatric medications?
In the general methods about the whole thesis, the paper says no one used any medications for 3 months prior to testing:
All patients and control subjects were medication free for at least three months.

For some reason, in a couple of the more sections about specific sub-studies, the time span is shorter. I would assume it should be 3 months for all the studies if the general methods said so.

For the ipsapirone study:
All subjects were medication free for at least 6 weeks before the study.

For the dexamethasone study:
No subject was admitted to the study who was taking any medication.

For the desipramine study:
None of the patients or controls was on any medication for at least six weeks before the study.

In any case, probably no one in the buspirone-prolactin study had used medication recently.

Edit: This is about the Majeed 1996 thesis, not the Bakheit 1992 thesis.
 
Last edited:
Back
Top Bottom