Preprint Initial findings from the DecodeME genome-wide association study of myalgic encephalomyelitis/chronic fatigue syndrome, 2025, DecodeMe Collaboration

Would you be able to answer my earlier question to Prof Ponting:

This non-scientist's understanding would benefit from knowing the variables involved in the gene-set analyses:
Z = B0 + C1.B1 + ... + CnBn + e


... is Z the 13 gene-analysis ones, or is it all 18k?
... is C1 a binary 0/1 for membership of each modeled gene in the gene-set (set of genes expressed in a tissue_

Hugely impressed you have done all that work and can get close to the study results - wrangling the actual data gives a better feel for what was actually done.
See here (different letters used but same idea):
To identify tissue specificity of the phenotype, FUMA performs MAGMA gene-property analyses to test relationships between tissue specific gene expression profiles and disease-gene associations. The gene-property analysis is based on the regression model,

Z∼β0+EtβE+AβA+BβB+ϵ

where Z is a gene-based Z-score converted from the gene-based P-value, B is a matrix of several technical confounders included by default. Et is the gene expression value of a testing tissue type c and A is the average expression across tissue types in a data set [...]

We performed a one-sided test (βE>0) which is essentially testing the positive relationship between tissue specificity and genetic association of genes.

The tissue gene-property analysis is a linear regression of all genes. Z is a gene's score from the GWAS and Et is a gene's expression in a tissue. Both of which are continuous, not binary.

For the gene-set analysis (the ubiquitin, synapse gene sets, etc), there's a binary variable on the right side instead - a gene is either in the gene set or not. The z-score on the left is still continuous.
 
See here (different letters used but same idea):


The tissue gene-property analysis is a linear regression of all genes. Z is a gene's score from the GWAS and Et is a gene's expression in a tissue. Both of which are continuous, not binary.

For the gene-set analysis (the ubiquitin, synapse gene sets, etc), there's a binary variable on the right side instead - a gene is either in the gene set or not. The z-score on the left is still continuous.

Fantastic - thanks so much. The paper confused me:
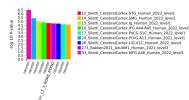
We considered 54 tissue types and identified significant enrichment of these genes’ expression for 13 (p < 0.05/54), all of which were brain regions

it wasn't clear what "these" referred to.
 
This lecture is interesting and relevant to our discussion:
MPG Primer: Linking SNPs with genes in GWAS (2022)

Don't understand everything, but there's some discussion that eQTL data and GWAS hits often do not match very well. Genes that are likely to be causally related to disease often do not have a lot of eQTL data.

This makes sort of sense because eQTL data is mostly about turning the gene expression on and off in different degrees, like a volume knob. But genes that are causally related to disease in GWAS will often be fine-tuned because turning the knob too high or too low becomes pathological. In other words, those with a lot of eQTL data are often those where the expression doesn't have a damaging effect on the organism, so perhaps not the ones we're interested in.

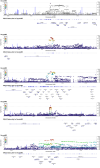
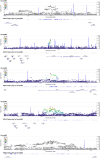
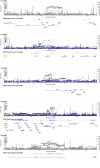
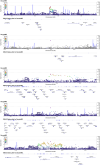
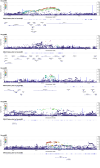
I suspect this mostly applies to diseases/conditions with clear hits and higher effect size, but perhaps it also applies to our quest to find the causal variants in DecodeME. For the hit on chromosome 1, for example, the paper highlights RABGAP1L because it has high coloc probability based on eQTL data in many different of tissues (see Figure 4 in the paper). But as the graph below shows, there are many other potential genes in the region, most of which are closer to the hit.
1755457894317.png

In the lecture, they mention that the closest gene is certainly not always the causal one but it is significantly more likely to be so than further away genes. So perhaps it would be worthwhile to highlight the closest 1-2 genes for each of the hits, as these are more likely to be relevant than others.
 
Last edited:
So perhaps it would be worthwhile to highlight the closest 1-2 genes for each of the hits, as these are more likely to be relevant than others.
The example locus you gave might be one of the harder ones to do this with because there are so many genes around the locus. There's a good chance the causal variant isn't the top hit, so one of the other variants near another gene might be causal.
 
Highlighting gene UNC13C, which seems the closest to the hits on chromosome 15. The gene card reads as follows:
Predicted to enable calmodulin binding activity and syntaxin-1 binding activity. Predicted to be involved in glutamatergic synaptic transmission and regulated exocytosis. Predicted to be located in presynaptic active zone. Predicted to be active in several cellular components, including axon terminus; presynaptic membrane; and synaptic vesicle membrane.
UNC13C Gene - GeneCards | UN13C Protein | UN13C Antibody
 
Last edited:
Another gene that hasn't been discussed yet but that seems the closest to the hit on chromosome 6q is POU3F2
This gene encodes a member of the POU-III class of neural transcription factors. The encoded protein is involved in neuronal differentiation and enhances the activation of corticotropin-releasing hormone regulated genes. Overexpression of this protein is associated with an increase in the proliferation of melanoma cells.
POU3F2 Gene - GeneCards | PO3F2 Protein | PO3F2 Antibody
 
This makes sort of sense because eQTL data is mostly about turning the gene expression on and off in different degrees, like a volume knob. But genes that are causally related to disease in GWAS will often be fine-tuned because turning the knob too high or too low becomes pathological. In other words, those with a lot of eQTL data are often those where the expression doesn't have a damaging effect on the organism, so perhaps not the ones we're interested in.
Great point—also the fact that a mutation could often be relevant for a reason that doesn't affect expression levels at all, but rather how it affects the binding affinity or accessibility of certain domains to ligands, regulatory enzymes and molecules, etc etc etc.

A particular mutation could be extremely relevant but have no eQTL data because the thing it does mechanistically is swap out an amino acid residue that can no longer get phosphorylated/acetylated/what have you and as a result that protein can’t get activated as strongly as it should. But the total amount of that gene’s transcripts or protein might remain relatively unchanged. So eQTLs provide information on one possible way that a SNP could be biologically relevant, but that’s about it.
 
PEBP1 seems like the second closest to the hit on chromosome 12, next to TAOK3, which seems very stretched out.
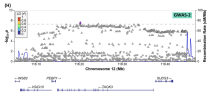
This gene encodes a member of the phosphatidylethanolamine-binding family of proteins and has been shown to modulate multiple signaling pathways, including the MAP kinase (MAPK), NF-kappa B, and glycogen synthase kinase-3 (GSK-3) signaling pathways. The encoded protein can be further processed to form a smaller cleavage product, hippocampal cholinergic neurostimulating peptide (HCNP), which may be involved in neural development. This gene has been implicated in numerous human cancers and may act as a metastasis suppressor gene. Multiple pseudogenes of this gene have been identified in the genome.
 
For the hit on chromosome 17, CA10 is the only candidate and it also clearly linked to neurons and synapses.
This gene encodes a protein that belongs to the carbonic anhydrase family of zinc metalloenzymes, which catalyze the reversible hydration of carbon dioxide in various biological processes. The protein encoded by this gene is an acatalytic member of the alpha-carbonic anhydrase subgroup, and it is thought to play a role in the central nervous system, especially in brain development. Multiple transcript variants encoding the same protein have been found for this gene.
So if we focus on the close-by genes, the clearest hits seem to point to neurons/synapses.

The exceptions are OLFM4 on chromosome 13, which has a clear immune connection (linked to severity of infection).

On chromosome 6p I think the butyrophilin3 and -2 homologues (BTN3A1, BTN3A2, BTN3A3, BTN2A1 and BTN2A2) seem most likely. The genes on the left that are closer are all part of a histone gene family, which encode the proteins that package DNA into chromatin - which seems less likely. The butyrophilin group also have a clear immune function: they are a immunoglobulin gene superfamily.
 
Are there any data on "permitted" co morbidities? So if depression was a permitted co-mo were depression associated genes found among those with such symptoms (which may be largely reactive).
 
Back
Top Bottom