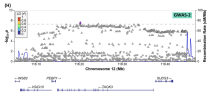
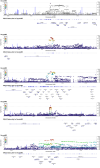
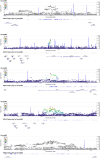
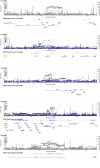
Preprint Initial findings from the DecodeME genome-wide association study of myalgic encephalomyelitis/chronic fatigue syndrome, 2025, DecodeMe Collaboration

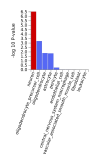
Is what's causing PEM activity of the brain in excess of what it can tolerate due to some problem at the synapses?

Is there any indication that glutaminergic synapses are playing a role in ME/CFS?

What's the similarity between autism and ME/CFS?
 
Like @forestglip and @ME/CFS Science Blog I’ve spent some time digging into some tools including magma/fuma and annovar. And learnt a bit about the myriad hurdles and technical issues bioinformatics students and researchers must live with. After a week much of my understanding is likely way off but I have a few questions, maybe they’re best for @Chris Ponting and the authors but perhaps others with more experience can chime in?

Were the GWAS summary statistics (hg38) or other/raw data used for MAGMA/FUMA analysis? What reference panel was used? These tools and the default panels seem to depend upon different human genome versions/reference assemblies than hg38, was liftover used or re-calling? I’m unsure about some other settings like the window size too, which could effect things quite a lot.

Knowing more about the methods, data and settings here would help reproducibility and understanding I think. And I wonder about what risks/loss there are with conversions between formats?

This study used an additive model I think, would it be worth exploring results from recessive/dominant models too?

I have learned new words like exonic, intronic and intergenic and as far as I can tell most findings (88%) from GWAS studies are in these interonic and intergenic regions. Although these don’t directly change the protein, it seems they can modify things a lot by effecting expression through things like translation.

There seems lots of scope for more analysis here, understanding what is in LD with the identified SNPs and using more tools like annotation to help get an idea of potential mechanisms. Or did the eQTL and risk loci cover this? I’ve not started looking at that yet and don’t understand the pros/cons of different methods.

Is this sort of wider analysis planned? Is the hope others may take it up? Would it be possible to make more of the data available to help others do this?

A bit of a mishmash of questions and thoughts….
 
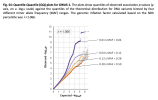
Don't think we have discussed this plot yet:
1755695341674.png
Basically, the idea is that if the difference between groups is driven by selection bias, stratification effects, ancestry differences etc., then there will be lower p-values across the board. It would look like a systematic shift where many SNPs are affected, too many to be explained by genetic differences underlying a disease.

A true effect of the genetic susceptibility for a disease should result in a smaller number of SNPs that are significantly different.

One way to test and differentiate between the two is to plot the p-values found against a uniform distribution of p-values (because that's what we would expect if there was no effect). If we're testing the genetics of the disease, then we would expect the observed p-values to differ from the expected, only at the very end, like a tail that bends upward. If there were a systematic difference, then the observed and expected would not match for many other p-values, and so the straight line would break and bend earlier. It would ot match a straight line through the origin with a slope of 1.

I have little experience with interpreting these plots, but it looks like there was some systematic difference for the low allele frequencies and no or much less for the common frequencies, which is where most of the hits were found. Because the observed p-values go all the way up to 10^-11, I assume this shows the full data before filtering based on quality control took place?

There is also an inflation measure, lambda = 1.066, which is the ratio of the observed to expected median p-value. Here, the same reasoning applies: these should be similar (so lambda should be close to 1). If not, it would suggest population differences other than having ME/CFS or not. A lambda of 1.066 looks fine.
 
Back
Top Bottom