CDC: Notes from the Field: Long COVID Prevalence Among Adults — United States, 2022
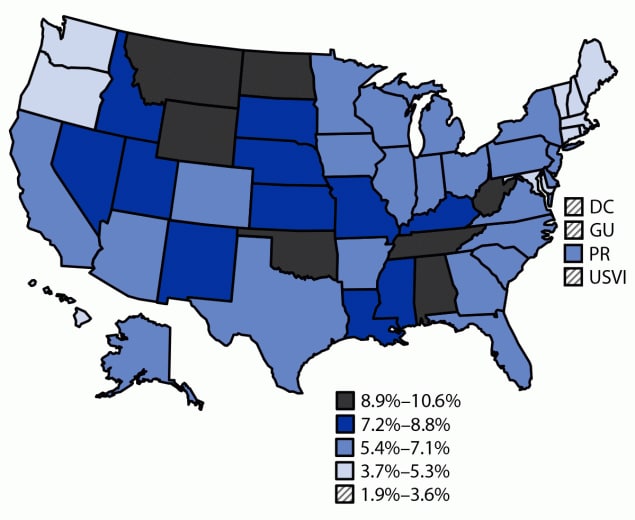
Prevalence of reported experience of Long COVID among adults aged ≥18 years, by jurisdiction — Behavioral Risk Factor Surveillance System, United States, 2022
Abbreviations: DC = District of Columbia; GU = Guam; PR = Puerto Rico; USVI = U.S. Virgin Islands.
View attachment 21832
View attachment 21833
Very small samples for the three that showed a very low prevalence, though.
If we are looking at a systems condition with likely multiple, perhaps interrelated factors to initiate or predispose we need a lot more nuance
How does a note detailed map look when adjusted for
population density
Rural v urban
Age in each state
Occupation ( linked to potential exposure)
Time of year of onset ( if we are looking at environmental factors, rural plus rotas for pesticide, herbicide, fertiliser for crops and dipping / spraying for animals may factor)
Air circulation routes for environmental factors and airborne pathogens . Some of these darker areas are edges of Hadley/ Ferrel / polar cells where air currents drop or pick up and change direction
I think it's a combination. Network analysis of different variables would be a good idea


")