Overview of RNA datasets for tissue and cell type enrichment analysis

ME/CFS Science Blog

Senior Member (Voting Rights)
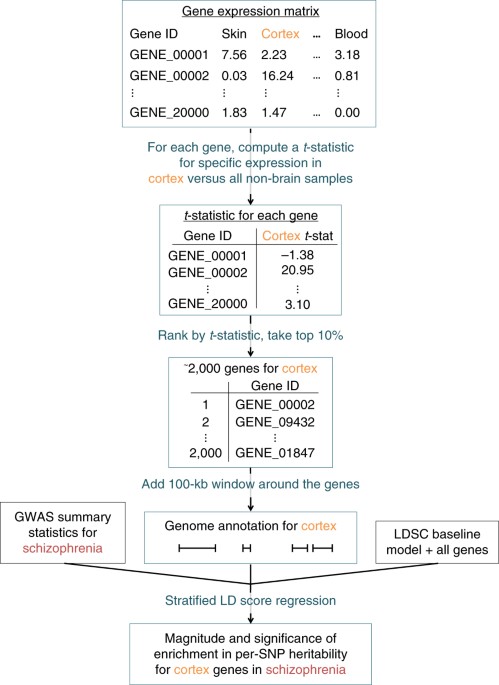
I thought it would be useful to make an overview of RNA datasets that we can match to the DecodeME DNA results. This could give us clues to which tissues or cell types are potentially involved in ME/CFS. I've made an overview of datasets below and plan to update it as we find new ones.

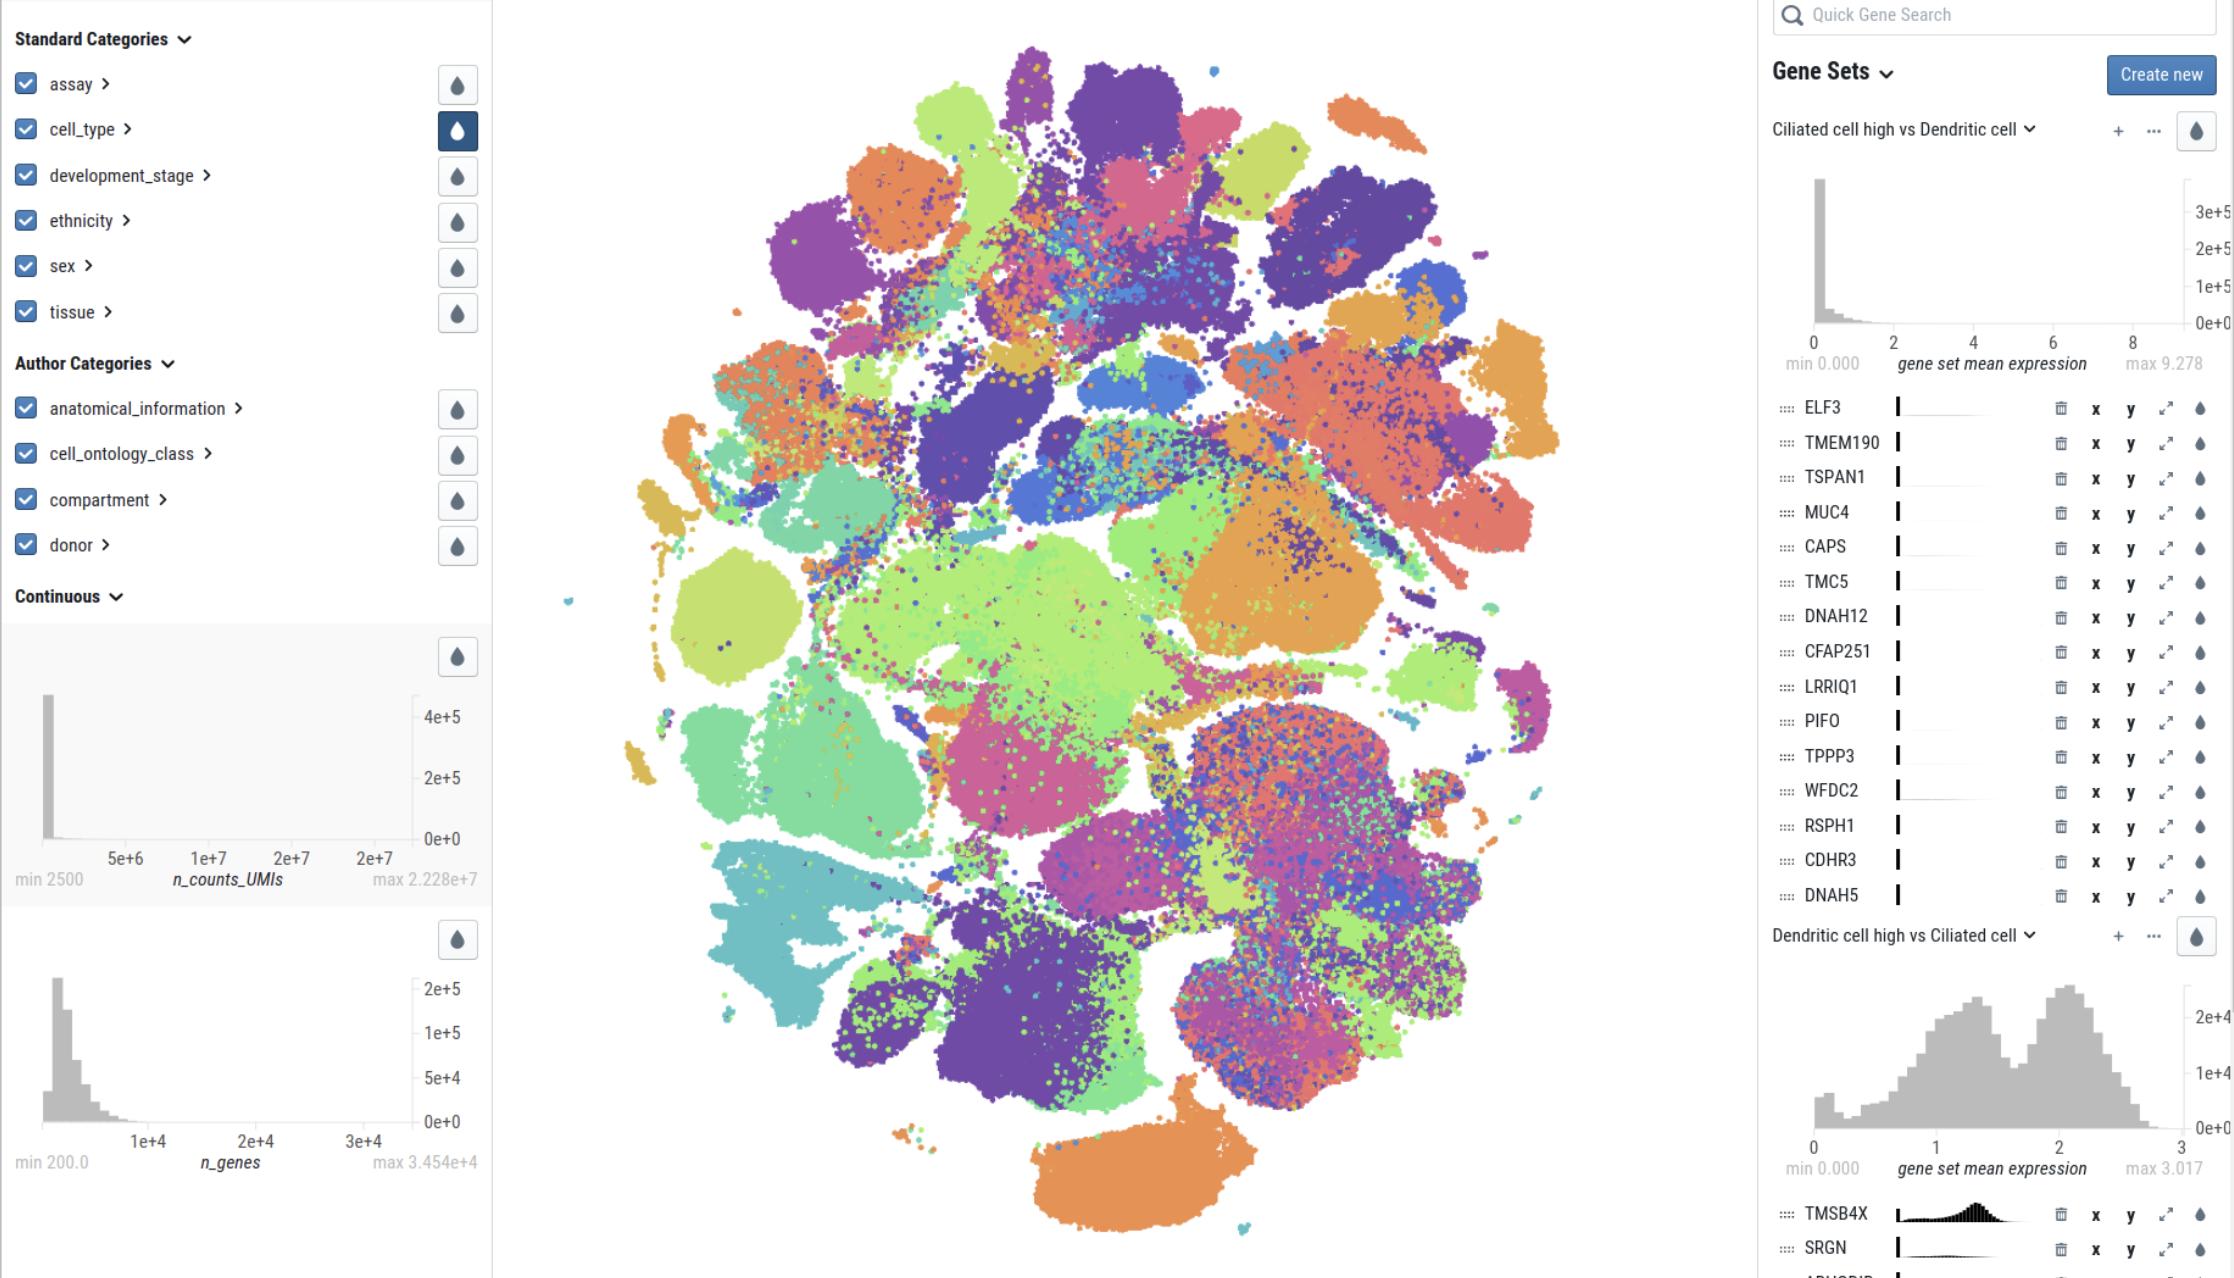
The Chan Zuckerberg Initiative’s CellxGene application is a nice respository where researchers can upload their data.
https://cellxgene.cziscience.com/

In the posts below, I'll share the results ME/CFS analyses that have been done with these datasets with a link to the relevant thread for more info. The current thread is only meant to provide an overview of all these analyses and discuss RNA datasets in general (in-depth discussion for a particular dataset or results are best reserved for the thread with the analysis itself).

NameAnimallocationPopulationSource
Genotype-Tissue Expression (GTEx)
The GTEx Consortium, Science 2020.
NIH funded.
HumanEntire bodyBulk-RNA
54 tissues
17,382 samples
838 postmortem donors
FUMA:
“Gene expression values are log2 transformed average RPKM per tissue type after winsorized at 50 based on GTEx RNA-seq data. Tissue expression analysis is performed for 30 general tissue types and 53 specific tissue types separately. MAGMA was performed using the result of gene analysis (gene-based P-value) and tested for one side (greater) with conditioning on average expression across all tissue types.”
https://fuma.ctglab.nl/tutorial#snp2gene
Human Brain Cell Atlas v1.0
Siletti et al. 2023
Linnarsson lab
Karolinska Institute
HumanBrain3 adult donors
~3 million cells
31 superclusters, 461 clusters
https://cellxgene.cziscience.com/collections/283d65eb-dd53-496d-adb7-7570c7caa443
DESCARTES
Cao et al. 2020
Shendure lab
Allen Institute
Human
Fetus
Entire body>110 fetal samples
15 organs
~4 million cells
https://cellxgene.cziscience.com/collections/c114c20f-1ef4-49a5-9c2e-d965787fb90c
Braun et al. 2023
Linnarsson lab
Karolinska Institute
Human
Fetus
Brain26 brain specimens
111 distinct biological samples
First semester (5 – 14 weeks post-conception)
~ 1.6 million cells
https://cellxgene.cziscience.com/collections/4d8fed08-2d6d-4692-b5ea-464f1d072077
Seeker 2023
CZI Cell Science
HumanBrainWhite matter
~ 0.048 million cells
https://cellxgene.cziscience.com/collections/9d63fcf1-5ca0-4006-8d8f-872f3327dbe9
Herring et al. 2022
(GSE168408)
Lister lab
HumanPrefrontal Cortex26 postmortem samples spanning 6 developmental stages: Fetal, Neonatal, Infancy, Childhood, Adolescence, and Adult.
~0.15 million cells
https://brain.listerlab.org/

https://console.cloud.google.com/storage/browser/neuro-dev/Processed_data;tab=objects?prefix=&forceOnObjectsSortingFiltering=false
Allen Brain Atlas
Sunkin et al. 2012
Allen Institute
HumanBrainTwo brains
(older dataset)
https://atlas.brain-map.org/

https://human.brain-map.org/static/download
Franke lab data
Fehrmann et al. 2015
Human,
mouse, rat
Entire bodyAffymetrix methodology
33 tissues
77,840 samples
GPL96: Homo sapiens: 17,309
GPL570: Homo sapiens: 37,427
GPL1261: Mus musculus: 17,081
GPL1355: Rattus norvegicus: 6,032
Used by the DEPICT tool and the Finucane et al. 2018 paper.

Is only available on a Google Cloud bucket where you have to pay for download costs.
https://console.cloud.google.com/storage/browser/broad-alkesgroup-public-requester-pays/LDSCORE/LDSC_SEG_ldscores;tab=objects
Saunders et al. 2018
Dropviz
Harvard
MouseBrain~0.69 million cellshttp://dropviz.org/
Mouse Brain Atlas
Zeisel et al. 2015-2018
Linnarsson lab
Karolinska Institute
MouseBrain9,970 cells
24 level 1 and 149 level 2 cell types
Cortex, Hippocampus Hypothalamus Midbrain, Oligodendrocytes, Striatum
https://github.com/NathanSkene/MAGMA_Celltyping

Used by Skene 2018, Olislagers 2018
ImmGenMouse292 immune cell typesArray-based methodology

Older version used in Finucane 2018: phase 1 (GSE15907) and phase 2 (GSE37448) data.
https://www.immgen.org/Databrowser19/DatabrowserPage.html

Older version by Finucane 2018, available in Google Icloud bucket.
Chiou et al. 2023
Allen Institute
BRAIN Initiative
Rhesus macaqueBrain5 animals
30 brain regions
~2.58 million cells
https://cellxgene.cziscience.com/collections/8c4bcf0d-b4df-45c7-888c-74fb0013e9e7
Zhang et al. 2023
Allen Institute
BRAIN Initiative
MouseBrain4 mice
~8.4 million cells
https://cellxgene.cziscience.com/collections/0cca8620-8dee-45d0-aef5-23f032a5cf09
 
Last edited:
Genotype-Tissue Expression (GTEx)
This analysis was done in the DecodeME preprint using the MAGMA tool on the FUMA website. The preprint only posted some of the most significant regions, but the entire plot looks something like this if you upload the DecodeME data. All significant tissue types are in the brain.

1782035948252.webp


GTEx is an NIH funded project with an explanation and background provided in this paper:
https://www.science.org/doi/10.1126/science.aaz1776

Here's the website with the GTEx data available for download:

The own used for DecodeME was an older version, version 8, while the most recent one is version 11. But I don't think the results would change much by redoing the analysis. It also handy that the FUMA website prepared the data in suitable format. It says:
“Gene expression values are log2 transformed average RPKM per tissue type after winsorized at 50 based on GTEx RNA-seq data. Tissue expression analysis is performed for 30 general tissue types and 53 specific tissue types separately. MAGMA was performed using the result of gene analysis (gene-based P-value) and tested for one side (greater) with conditioning on average expression across all tissue types.”
Source: https://fuma.ctglab.nl/tutorial

You can download it from their website:
 
Last edited:
GTEx6 + Franke Lab
An older version of the GTEx (version 6) was combined with RNA data from Franke's lab in the study by Hilary Finucane et al. 2018. This is the paper where they introduced the LDSC-SEG approach to testing cell type enrichment and where they tested multiple diseases and traits.

The Franke Lab data refers to a collection of older human, mouse and rat RNA datasets that were available on the (former) online tool DEPICT. It was grouped to 33 tissues. More info about it, is available in the supplementary material of Finucane et al. 2018 and this paper from Lude Franke's group (Fehrman et al. 2015):

I and Trafalmadorian97 have tried to replicate the Finucane et al. 2018 pipeline but with the DecodeME dataset. The results look like this, again only highlighting the brain tissue:s
1782038520492.webp

Source: S-LDSC - ME/CFS Biostatistics Home

I also compared the ME/CFS analysis to those from other diseases provided in supplementary table 6 of the Finucane paper. It looks like this:
1782038621431.webp
Thread:
 
Human Brain Cell Atlas v1.0
This is currently the most extensive dataset on brain cells in humans. Published in 2023 by the lab of Sten Linnarsson at the Karolinska Institute, one of the important teams that have been making multiple RNA datasets over the years.

The relevant paper is Siletti et al. 2023:

And the data is available here:

There are different ways to analyse this data. The FUMA website standardizes gene expression per dissection, creating multiple smaller datasets. Paolo Maccalini used this in his meta-analysis of DecodeME and the Million Veterans Program (MVP) dataset. The results mainly pointed to eccentric medium spiny neurons. His paper is discussed here:
https://s4me.info/threads/biologica...encing-of-me-cfs-2026-maccallini-et-al.50225/

The FUMA approach of working per dissection means that the gene expression per cell type is influenced by whatever else is in the dissection dataset. This makes it more variable and perhaps less robust. When I applied it to DecodeME only (not the meta-analysis) or used a different MAGMA window size, I got different results.
https://s4me.info/threads/biologica...026-maccallini-et-al.50225/page-6#post-699621

The Duncan et al. 2025. paper standardizes gene expression by the entire dataset. Trafalmadorian97 applied this analysis to the DecodeME dataset and got the following results, also finding eMSN as the top hit.
1782039509899.webp
Source: https://trafalmadorian97.github.io/...nalysis/ME_CFS/DecodeME/h_MAGMA-HBA-DecodeME/

I got a similar result and an even stronger signal when using the DecodeME + MVP meta-analysis. It looked like this:
1782039720044.webp
Source: https://s4me.info/threads/biologica...026-maccallini-et-al.50225/page-6#post-699621

We can also compare ME/CFS results to other diseases analyzed by Duncan et al using the same approach. For example the plot below highlighted the results for eMSN in different diseases.
1782039892739.webp
Thread: https://s4me.info/threads/eccentric-medium-spiny-neuron-emsn.50276/post-695111
 
DESCARTES
This is also a major dataset with a lot of strong points: multiple tissues, in humans, 4 million cells. The main limitation is that it is from foetuses so may not directly apply to the cell types in adults.

The main paper is Cao et al. 2020:

And the raw data is available here:

This dataset was applied to DecodeME in a recent preprint by Jun Hyun Lee. It analysed level 2 which has 77 different cell types. The strongest signals were for inhibitory neurons. Here's a link to the full results, posted on the forum:
 
A note on the FUMA platform datasets
The FUMA platform contains many of these dataset and makes it easy to test for them by uploading your data. Their approach is explained in this preprint:

We have previously found significant links to white matter cells from the Seeker dataset (in the Maccalini paper), striatal cells from Dropviz (also Maccalini paper) and neurons from the Braun fetal dataset using FUMA. But FUMA divides these datasets in smaller bits, often by dissection. I think it would be worthwhile to try to re-analyze them by standardizing gene expression for the entire dataset, similar to what Duncan et al. did with the Human Brain Atlas.
 
A recent and useful lecture on the limitations of cell-type enrichment analysis with GWAS data. It's from Rachel Brouwer, a member of the Posthuma group that produced FUMA, MAGMA, FLAMES, etc.


The conclusion is a bit sobering. These analyses work well for broad cell types (like neurons, glia, B-cells, etc.) but probably not yet for more specific cell types.

There are multiple choices to make in the statistical analysis, and many of these choices have a substantial influence on the results. In addition, there is often a strong correlation among cell types, which makes it difficult to differentiate them. Third, many of these RNA datasets are based on a very limited number of donors (medium of 5).

She says (minute 13:10): "....for now, my conclusion would be: broad cell types are fine, but if you ask me to give you a fine-grain cell type, I don't have too much confidence in using only this as a reason to do lab work, which is very unfortunate. I've been hesitating a long time to say this out loud but here we are. I don't think this is this should be the only reason to pick a cell type."
 
Back
Top Bottom