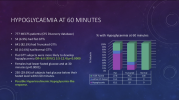
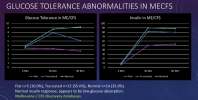
I see in the slide on the left that there are three different insulin repsonses. All three rise at the same time, but to different levels, so each group is making a different amount of insulin. Is this to the same stimulus?
The green people's sugar is staying high after the insulin secretion time point, so they are insulin resistant.
The blue people's sugar is dropping in response to insulin secretion, so they are not insulin resistant.
The purple people's sugar isn't rising, so who knows why they are secreting more insulin (but at least not as much). Their sugar drops a bit with insulin secretion, maybe into slightly hypoglycemic range.
Second issue- the vertical axis of the graph isn't labelled, just to make things more confusing. If these sugars are in nmol/L then most of them are in the normal range postprandially. Normal for non-diabetics postprandial is 7.8nmol/L. Only the green people need worry about diabetes/prediabetes... and maybe not even then. The American Diabetes Association is happy if diabetics can keep sugars under 10nmol/L 2 hours after a meal, and no one here gets that high. So... maybe that's why they aren't talking about insulin resistance-not enough to quite mean diabetes.
I don't know. the whole thing is confusing and my brain is pickled.


