Replicated blood-based biomarkers for Myalgic Encephalomyelitis not explicable by inactivity, 2024, Beentjes, Ponting et al

Wasn't the glucose profile the other way around in McGregor (low) - opposite of insulin resistance?
I need to rewatch the video on the actual glucose response test measurement results. I did find this 2019 McGregor paper (link) which reported a 1.2-fold rise in glucose in the results section.
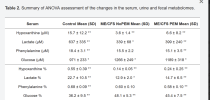
Glucose was increased in the ME/CFS cases (both NoPEM and PEM 1.2-fold higher versus controls).

The paper also highlights the glucose : lactate ratio in PEM as changed.
The principal biochemical change related to the 7-day severity of PEM was the fall in the purine metabolite, hypoxanthine. This decrease correlated with alterations in the glucose:lactate ratio highly suggestive of a glycolytic anomaly.

1750781905705.png
 
Last edited:
Wasn't the glucose profile the other way around in McGregor (low) - opposite of insulin resistance?
I believe he said glucose went up (at least intitially) as it would in burn victims. I don't think he mentioned insulin resistance specifically... Can you have an increase in serum glucose without insulin resistance, say by increased gluconeogenesis?
 
It is confusing. Does anyone know if there was a paper published on the Don Lewis clinic glucose tolerance testing?

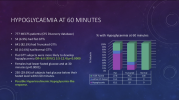
Slide at 11:00 showing:
* 641 of 777, 82%, ME/CFS patients from Don Lewis who had a glucose tolerance test with complete data had a truncated glucose tolerance test response. ~20% of those were hypoglycemic at 60 mins.
* 54 of 777, 7%, had a flat response and at 60 mins ~60% (32/54) of those exhibited hypoglycemia - first column on graph, purple colour.
* Only 82 of 777, 11%, had a normal response!
* Note : 1155 glucose tests. There was a large 33% excluded for not having complete data.
.
1750788175126.png
 
Last edited:
I don't see if the hypoglycemia here is indicating insulin resistance. Some of these people are making too much insulin (hyperinsulinemic) and that is causing their blood sugars to drop. If they were insulin resistant I would expect hyperinsulinemia to make a normal blood sugar, not a low sugar. That's the definition of insulin resistance, yes? Huge amounts of insulin don't make your sugar go down much if at all. Here huge amounts of insulin are causing low sugars... in some.

What does a truncated response mean? The test stopped before time?
 
A truncated test is a test that just samples at one hour. I don't know what a 'truncated response' would be, if there is such a thing.
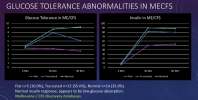
Sorry, I was going to add this graph from 9:55 in the video to explain what they mean by truncated but I ran out of energy to post it.

This is a reduced number of patients n=41 that also had insulin data and the slide explains the characteristics of the different responses. Insulin response is stated as being normal and there appears to be low glucose absorption (utilization for energy?).

1750792587590.png

Note that the Beentjes paper did not measure insulin resistance directly, they show that proxy markers for insulin resistance characteristics are elevated. What I'm wondering, are Beentjes et al and McGregor et al looking at the same thing but from different angles?

Do you think we can say for certain that Beentjes et al proves there is insulin resistance or could be it low glucose absorption/utilisation as written in the slide?
 
Do you think we can say for certain that Beentjes et al proves there is insulin resistance or could be it low glucose absorption/utilisation as written in the slide?
I would think that low glucose absorption is insulin resistance by another name. Glucose is absorbed into the cell from the bloodstream due to the action of insulin on the glucose receptor- metephor about insulin is the key that unlocks the door to let glucose into the cell. I don't know how you would have low glucose absorption without insulin resistance... but that maybe my lack of knowledge. Now maybe you could have low glucose utilization inside the cell if glycolysis is messed up, but isn't that a different problem from absorption?

And why does he have to call the first slide glucose tolerance? Glucose tolerance is a composite measure of insulin resistance and beta cell function. The slide is really showing blood sugar levels, right? You can't infer glucose tolerance from blood sugar levels without more info. If I am glucose tolerant I can eat a whole bag of Oreos and have stable sugar and if I am glucose intolerant I can eat a tiny slice of whole wheat and have my sugars go crazy. If you just look at my sugar and not the meal...

This looks more confusing the more i look at it....
 
What I'm wondering, are Beentjes et al and McGregor et al looking at the same thing but from different angles?

Do you think we can say for certain that Beentjes et al proves there is insulin resistance or could be it low glucose absorption/utilisation as written in the slide?

I don't think they are alluding tothe same thing at all. I think the two sets of data do not fit in any sensible way.

I think we are now seeing that the cohort that the Beentjes paper is based on has serious uncertainties about how representative it is and therefore how likely it is to involve confounding biases like insulin resistane and subclinical acute-phase response. The indirect evidence for insulin resistance remains of interest but I cannot at present see any way it will help us understand ME/CFS. It isn't going to be an upstream factor I would say.
 
I see in the slide on the left that there are three different insulin repsonses. All three rise at the same time, but to different levels, so each group is making a different amount of insulin. Is this to the same stimulus?

The green people's sugar is staying high after the insulin secretion time point, so they are insulin resistant.

The blue people's sugar is dropping in response to insulin secretion, so they are not insulin resistant.

The purple people's sugar isn't rising, so who knows why they are secreting more insulin (but at least not as much). Their sugar drops a bit with insulin secretion, maybe into slightly hypoglycemic range.

Second issue- the vertical axis of the graph isn't labelled, just to make things more confusing. If these sugars are in nmol/L then most of them are in the normal range postprandially. Normal for non-diabetics postprandial is 7.8nmol/L. Only the green people need worry about diabetes/prediabetes... and maybe not even then. The American Diabetes Association is happy if diabetics can keep sugars under 10nmol/L 2 hours after a meal, and no one here gets that high. So... maybe that's why they aren't talking about insulin resistance-not enough to quite mean diabetes.

I don't know. the whole thing is confusing and my brain is pickled.
 
I would think that low glucose absorption is insulin resistance by another name.

I don't think it is that simple. Insulin resistance refers to the inability of insulin to control circulating blood sugar. Yes, insulin is involved in absorption, but I think that is a different issue. People with insulin resistance have highblood sugar, not low, as described here. The slide is not showing insulin resistance as normally understood.

And if it is a glusoce tolerance test it is showing 'glucose tolerance' which is defined as what that test shows. There is a glucose challenge and tolerance is the ability to keep the level down. That is, as you say, not quite the same as insulin resistance but if subjects end up with hypoglycaemia then this is a problem with glucose tolerance either. Unless I have been totally confused by the wording. I sam still unclear what is meant by a truncated response.
 
What other isues could these be?

The issue of the effect of insulin on absorption is different from the issue of insulin controlling circulating glucose by getting it to by taken up by cells (and not passed on to the blood as is the case for gut cells). They may both involve insulin receptors but they are different measured functions.
 
Back
Top Bottom