Oh yes sorry, just saw your post. Yes, that was incorrect to say it was the NIH study.I don't think it is. It seems to be a reanalysis of data from a Charite study:
B. Jäkel, C. Kedor, P. Grabowski, et al., “Hand Grip Strength and Fatigability: Correlation With Clinical Parameters and Diagnostic Suitability in ME/CFS,” Journal of Translational Medicine 19, no. 1 (2021): 159, https://doi.org/10.1186/s12967-021-02774-w.
You are using an out of date browser. It may not display this or other websites correctly.
You should upgrade or use an alternative browser.
You should upgrade or use an alternative browser.
Variation in Repeated Handgrip Strength Testing Indicates Submaximal Force Production in Patients With [ME/CFS], 2025, Popkirov
- Thread starter forestglip
- Start date
ME/CFS Science Blog
Senior Member (Voting Rights)
Had a closer look at the raw data, available here:

 translational-medicine.biomedcentral.com
EDIT: posted some other graphs earlier but these were incorrect (they focused on the variation per group rather than per individual).
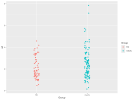
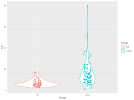
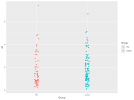
Below is a graph of the standard deviations for each participant across the 10 repetitions of the first round. The variance looks bigger in ME/CFS but it's not a dramatic difference.

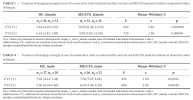
The Coefficient of Variation (CV) divides these SDs by the mean and because ME/CFS patients had consistently smaller mean strength than controls, the CV comparison shows a major difference.


Hand grip strength and fatigability: correlation with clinical parameters and diagnostic suitability in ME/CFS - Journal of Translational Medicine
Background Myalgic Encephalomyelitis/Chronic Fatigue Syndrome (ME/CFS) is a complex and debilitating disease accompanied by muscular fatigue and pain. A functional measure to assess muscle fatigability of ME/CFS patients is, however, not established in clinical routine. The aim of this study is...
EDIT: posted some other graphs earlier but these were incorrect (they focused on the variation per group rather than per individual).
Below is a graph of the standard deviations for each participant across the 10 repetitions of the first round. The variance looks bigger in ME/CFS but it's not a dramatic difference.

The Coefficient of Variation (CV) divides these SDs by the mean and because ME/CFS patients had consistently smaller mean strength than controls, the CV comparison shows a major difference.

Last edited:
Evergreen
Senior Member (Voting Rights)
Indeed. The difference disappears for males but not females when they account for peripheral fatigue. This excludes nearly half of the females and males with ME/CFS from the second analysis on the following basis:The difference seems quite large. So apart from the authors interpretation what would be the most likely explanation for this? Is it simply that being ill/having lots of symptoms causes the variation in handgrip strength measurements?
the sum of the first two measurements divided by the sum of the last two measurements within one session is used as an index of fatigability (IF)
only patients with an IF within 2 SD of the mean [index of fatigability] in healthy controls of the respective gender will be included in a second analysis.

If the half that were included in the second analysis had significantly different indices of fatigability from the healthy controls, would that explain it?
Last edited:
Evergreen
Senior Member (Voting Rights)
Oh good, I couldn't understand it so I'll come back later after a rest!EDIT: posted some graphs and data but with some errors. Will update later
ME/CFS Science Blog
Senior Member (Voting Rights)
Was looking at one of the reference in the paper, a review Shechtman 2000 which was highly critical rather than supportive of the measure. It also points out what seems to be the issue here:The Coefficient of Variation (CV) divides these SDs by the mean and because ME/CFS patients had consistently smaller mean strength than controls, the CV comparison shows a major difference.
So I think that's whats happening here: the standard deviations between patients and controls are comparable. If you divide, however, by the mean to get the CV, then it becomes inflated in ME/CFS patients because they have much less force. Larger mean grip forces do not necessarily show greater absolute variability, so the CV measure seems inappropriate to compare populations with different strength.The problem with using the CV when the average and standard deviation do not change proportionally is that CV values become inflated. The formula for the CV has the standard deviation as the nominator and the average as the denominator. Therefore, for the CV to be greater, either the standard deviation has to be greater or the average has to be smaller. Average grip strength is reduced both during submaximal effort and with hand injury. Consequently, the CV may increase because of the decreased average, not because of a true increase in variability (standard deviation). The fictitious data presented in Table 5 show that when the CV is used to assess sincerity of effort in weaker people, the CV values may be inflated because of the decrease in average strength. [...] In fact, Mitterhauser et aL17 found that the CV of three grip repetitions was significantly greater in injured than in uninjured subjects. [...] Shechtman52 showed that, following carpal tunnel release surgery, the CV increased as grip strength decreased, while the standard deviation remained the same
It also seems that reviews around the year 2000 concluded that this was not a reliable measure and that it hasn't been used much since.
ME/CFS Science Blog
Senior Member (Voting Rights)
In the graph above the greater variance in ME/CFS could be due to the decline in strength over the 10 repetitions. If I take only the first 3 repetitions, the variation between groups looks similar.Below is a graph of the standard deviations for each participant across the 10 repetitions of the first round. The variance looks bigger in ME/CFS but it's not a dramatic difference.

Evergreen
Senior Member (Voting Rights)
Excellent debunking. Will you write a letter to the journal?So I think that's whats happening here: the standard deviations between patients and controls are comparable. If you divide, however, by the mean to get the CV, then it becomes inflated in ME/CFS patients because they have much less force. Larger mean grip forces do not necessarily show greater absolute variability, so the CV measure seems inappropriate to compare populations with different strength.
Letters to the Editor: max. 500 words, including a maximum of five references. Letters express views about articles published in EJoN or present ideas or findings of scientific interest that do not constitute original research. Letters to the Editor are published online only.
Comment on “Variation in Repeated Handgrip Strength Testing Indicates Submaximal Force Production in Patients With Myalgic Encephalomyelitis/Chronic Fatigue Syndrome”
Felix Steinkirchner, Viktoria Kimmerling, Christina Kaufmann, Elisabeth Schieffer, Michael Gruber, Alexander Dejaco
See article for full comment.
Web | PDF
Felix Steinkirchner, Viktoria Kimmerling, Christina Kaufmann, Elisabeth Schieffer, Michael Gruber, Alexander Dejaco
We have read the recent article titled “Variation in Repeated Handgrip Strength Testing Indicates Submaximal Force Production in Patients With Myalgic Encephalomyelitis/Chronic Fatigue Syndrome” by Popkirov with great interest [1]. The author proposes that increased variability in handgrip strength (HGS) reflects higher-order motor control disturbances in individuals with ME/CFS. While we appreciate this effort, several methodological issues regarding the application of the coefficient of variation (CV) for this purpose require clarification.
See article for full comment.
Web | PDF
Last edited:
Response to the Comment by Steinkirchner et al. On the Article “Variation in Repeated Handgrip Strength Testing Indicates Submaximal Force Production in Patients With Myalgic Encephalomyelitis/Chronic Fatigue Syndrome”
Stoyan Popkirov
See article for full response.
Web | PDF
Stoyan Popkirov
I thank Steinkirchner et al. for their comments, which I address in turn.
See article for full response.
Web | PDF
Utsikt
Senior Member (Voting Rights)
In the response by the author of the paper:
Maybe the author would have benefited from clearly defining what they mean by higher order motor control, and exactly where in this process they believe the error lies.
Furthermore the author attempts to place the burden of proof with the commenters:
Then there is the ending:
Yet, the treatment the authors proposes in the paper targets 2) explicit self-efficacies, 2) maladaptive exertion avoidance, and 3) suboptimal coping and recovery strategies:At no point do I interpret the findings as indicating insincerity. On the contrary, I state that it is clinically “abundantly clear that the weakness seen in patients with ME/CFS is not a matter of […] poor motivation”, and discuss how clinical and electrophysiological observations of submaximal contractions in many disorders are not an indication of insincerity [3].
So while the author might not have used «insincerity», the suggested treatments heavily imply that it is at least in part a behavioural issue. It looks very similar to the arguments used with regards to FND.Treatment should accordingly aim at iterative reinforcement of explicit and implicit self-efficacies of movement by demonstrating untapped strength reserves, addressing maladaptive exertion avoidance and providing guidance on coping and recovery strategies.
Maybe the author would have benefited from clearly defining what they mean by higher order motor control, and exactly where in this process they believe the error lies.
Furthermore the author attempts to place the burden of proof with the commenters:
Alternatively, they say that their method is good enough because the other ones aren’t any better. Which obviously isn’t true if all of them are bad.As an indicator of submaximal force production, CV is undoubtedly imperfect; however, neither Shechtman nor Steinkirchner et al. provide a more reliable alternative for quantifying the variability that results from higher-order strength grading.
Then there is the ending:
Those sources were not mentioned by the commenters, and the author apparently saw fit to include two unsubstantiated digs at other researchers out of nowhere.In their concluding remarks, Steinkirchner et al. call for greater caution when interpreting experimental findings in insufficiently understood disorders such as ME/CFS. This point is well taken, and it should be borne in mind before attributing poorer handgrip performance to muscle dysfunction and peripheral fatigue rather than to higher-order processes such as central fatigue [4, 5].
The comment critical of the paper is interesting. An excerpt:Comment on “Variation in Repeated Handgrip Strength Testing Indicates Submaximal Force Production in Patients With Myalgic Encephalomyelitis/Chronic Fatigue Syndrome”
Felix Steinkirchner, Viktoria Kimmerling, Christina Kaufmann, Elisabeth Schieffer, Michael Gruber, Alexander Dejaco
Second, CV calculated from rapid, repeated HGS trials is inherently confounded by fatigability. Even healthy individuals show measurable decline when repetitions are closely spaced, and ME/CFS patients exhibit a steeper decline correlated with disease severity [5]. Under these conditions, elevated CV is at least partly attributable to fatigability rather than altered motor control. Although the author excluded participants with pronounced fatigability, residual decline persists and could inflate CV (Figure 1). Also, the fatigability- based exclusion criterion removes subjects with the largest force decline, arguably representing more severe disease [5]. Such selective attrition distorts variance estimates and may obscure true group differences. Instead, more robust statistical modelling approaches would be preferable.
Third, the measurement protocol used differs substantially from those in which CV was originally proposed. Earlier studies conducted either few discrete trials with rest or analysed single- grip force–time curves – conditions unlikely to induce fatigability [2]. These findings cannot be directly transferred to a 10- repetition protocol, further limiting interpretability.
Finally, we were unable to reproduce the reported participant numbers using the publicly available dataset, despite applying the stated exclusion criteria.
Yes, that struck me too. I thought the whole point of studying repeated hand grips in ME/CFS was to study fatigability. Otherwise, what's the point?Although the author excluded participants with pronounced fatigability
Which by definition would rule out most ME/CFS patients. So what is it they are studying?
