Abstract
The ME/CFS classification machine learning model, HEAL2, described in a preprint from Zhang et al (1) incorporated loss-of-function variants from a cohort of participants with and without ME/CFS, as well as the STRING database’s protein-protein interaction network in its training. The model included a mechanism which allowed for creating an attention score for every gene to allow for better interpretability.
Thus, to determine biological relevance of the model’s highest ranked genes, ranked gene set enrichment analysis (GSEA) was performed on the model’s gene list, using the attention score as the ranking metric. Local clusters of proteins provided by STRING were used as the gene sets of interest, as these clusters would plausibly correspond to the protein-protein interaction data incorporated during model training.
The clusters which passed a threshold of significance and enrichment were then used for a subsequent ranked GSEA using the SKATO p values for genes from the Genebass database, which provide a measure of the association between loss-of-function variants in these genes and ME/CFS.
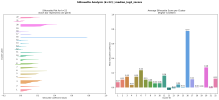
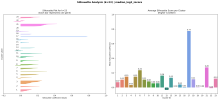
2 of 50 clusters met an FDR threshold of q<0.25 in this final GSEA.
Mapping gene names from HEAL2 to STRING-DB identifiers.
STRING GSEA is able to automatically convert various gene identifiers to STRING’s own gene identifiers. However, mapping was performed using the STRING API beforehand to determine what proportion of provided genes could be converted to STRING IDs.
Using the information from Supplementary Table 2 from Zhang 2025, all 17759 provided genes were sent to the STRING API for mapping. 17533 genes (~98.7%) were returned with STRING identifiers which were used in the subsequent analysis. The API did not return identifiers for 226 genes. Followup queries of the STRING API with these remaining genes revealed that 64 of these genes were considered synonyms for already mapped genes by STRING (e.g. ZASP as a synonym LDB3) and 162 genes could not be identified by STRING (e.g. ACP2). Of this last group of genes, two appear to have been errors in data entry, as the gene fields have dates instead of genes.
STRING GSEA using HEAL2 genes
Using the STRING API, the 17533 genes, along with their attention scores, were used to run a ranked GSEA. A URL was returned which provides an
interactive webpage for viewing the results. (2)
Using the settings on the GSEA results page, gene sets were filtered for false discovery rate (FDR) <= 0.01, enrichment score >= 1.0, and minimum count in gene set of 10. Gene sets were filtered for those enriched at the top of the input, which represent the gene sets associated with high attention scores. Further, gene sets with similarity (based on Jaccard index) >= 0.7 were merged (only the most significant of the similar clusters were displayed). This resulted in a filtered list of 52 enriched STRING local network clusters.
The most enriched of these clusters was CL:22984, with an enrichment score of ~3.43 and an FDR of 7.50e-11, and which is described by STRING as representing “Neurexins and neuroligins”. (3)
GSEA on ME/CFS cases from Genebass
Using the biomaRt R library, the protein identifiers from the STRING clusters were converted to HGNC symbols to match with the data on ME/CFS from Genebass. Of 740 unique proteins, 7 did not automatically convert, and their corresponding HGNC symbols were looked up manually using the STRING web interface. The clusters were then written to a GMT file to act as gene sets for GSEA.
From the Genebass web interface, summary statistics were downloaded for predicted loss of function (pLoF) variants for chronic fatigue syndrome.(4) An RNK file containing all of the included genes and their corresponding SKATO p-values was created. Finally, GSEA v4.4.0 for Linux was used to run preranked GSEA with the created RNK and GMT files. Minimum gene set size was set to 10.
50 of 52 gene sets met the size threshold and were analyzed for enrichment. The
GSEA report is accessible online.(5) Two gene sets met an FDR threshold of 0.25, though it should be noted that these gene sets are small (16 and 10 genes, corresponding to the following two clusters respectively) and they had very few leading edge genes (2 and 3 respectively).
*
CL:23065, Ionotropic glutamate receptor, and Neurotransmitter receptor transport, postsynaptic endosome to lysosome (Normalized Enrichment Score = 1.39, FDR q-val = 0.220)
*
CL:6643, PR-DUB complex, and Methyl-CpG-binding domain protein (NES=1.31, q=0.229)
--------
1. Zhang S, Jahanbani F, Chander V, Kjellberg M, Liu M, Glass KA, et al. Dissecting the genetic complexity of myalgic encephalomyelitis/chronic fatigue syndrome via deep learning-powered genome analysis [Internet]. medRxiv; 2025 [cited 2025 May 23]. p. 2025.04.15.25325899. Available from:
https://www.medrxiv.org/content/10.1101/2025.04.15.25325899v2
2. Enrichment Results - STRING database [Internet]. [cited 2025 May 23]. Available from:
https://version-12-0.string-db.org/cgi/globalenrichment?networkId=baSYcIb9YQhy
3. CL:22984 - STRING interaction network [Internet]. [cited 2025 May 23]. Available from:
https://version-12-0.string-db.org/cgi/network?networkId=bd4ZcN9E0DnX
4. Genebass - Chronic fatigue syndrome [Internet]. [cited 2025 May 23]. Genebass - Chronic Fatigue Syndrome. Available from:
https://app.genebass.org/gene/undef...?resultIndex=gene-manhattan&resultLayout=full
5. Genebass GSEA report [Internet]. [cited 2025 May 23]. Available from:
https://glittery-tarsier-413b2d.netlify.app/gsea/cfs_string_clusters.gseapreranked.1748034397906/