Hi everyone,
I am Fabian Niess, one of the authors involved in the spectroscopy part of the study. Thanks for the careful discussion and, in particular, for raising the question about the relatively prominent lactate signal in the representative healthy-control spectrum. Lukas already gave the short answer, but I wanted to add a little more spectroscopy detail.
The appearance of an MR spectrum depends quite strongly on the acquisition parameters. In our study, we used a semi-LASER MRSI sequence at 3 T with TE = 135 ms. This relatively long echo time was chosen deliberately to improve specificity for lactate. Around this TE, the lactate resonance at approximately 1.3 ppm is strongly J-modulated and appears inverted. At the same time, much of the short T2 macromolecular and lipid background has decayed. Semi-LASER localization also restricts the excited volume to a central volume of interest, helping to reduce contamination from extracranial lipids.
For this reason, the lactate signal in Figure 2c should not be compared directly by eye with a conventional short-TE spectrum. Peak height is also not equivalent to metabolite concentration. At TE = 135 ms, the relative appearance of lactate and creatine is influenced by their different relaxation properties as well as the J-evolution of lactate. Creatine is substantially attenuated at this echo time, which contributes to lactate appearing relatively prominent. The inverted signal and relatively flat surrounding baseline are also reassuring with regard to lipid contamination, although residual contamination cannot be completely excluded.
As an additional sidenote, the spectra in Figure 2 are representative individual examples rather than group averages. For the healthy control shown there, the estimated lactate concentration was approximately
0.71 mM during normoxia and 1.55 mM during hypoxia. In the representative ME/CFS patient, lactate was approximately
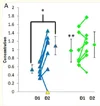
1.25 mM and remained essentially unchanged with hypoxia. Thus, the visual difference reflects the intended example: a clear hypoxia-induced lactate increase in this particular control versus an already elevated and comparatively unchanged value in the patient. The group-level statistical results are shown separately in Figure 5.
Importantly, these concentrations in mM are only approximate estimates. Converting the measured Lac/tCr signal into an absolute concentration requires several assumptions, including the underlying creatine concentration and relaxation effects. The resulting values should therefore be interpreted with considerable caution and are mainly useful as a plausibility check rather than as formal absolute quantification. This is also why we chose to report the spectroscopy results as
Lac/tCr ratios, which remain closer to what was directly measured and require fewer assumptions. Nevertheless, values on the order of ~1 mM of our healthy cohort are compatible with reported healthy-brain lactate concentrations.
Another question concerned why the characteristic lactate doublet is not clearly resolved into two separate components. At 3 T, their separation is relatively small compared with the achievable spectral linewidth. Residual B0 inhomogeneity, relatively large spectroscopic voxels and regional averaging can therefore cause the components to merge into a broader inverted feature. Thus, not seeing two clearly separated minima does not by itself argue against the signal being lactate.
This also highlights an important limitation of the present proof-of-concept study: we used a single-slice, 2D phase-encoded MRSI acquisition with relatively large nominal voxels (~1.5 mL), so point-spread and partial-volume effects are relevant and some contribution from surrounding tissue or ventricular CSF cannot be completely excluded.
For future studies, however, there is considerable room for a methodological step forward. Our group developed accelerated
3D MRSI using non-Cartesian concentric-ring-trajectory (CRT) encoding, which can replace the slow conventional phase encoding used here and allows for much more efficient spatial-spectral sampling and significant acceleration. We adapted this concept specifically for lactate by combining
3D CRT encoding with semi-LASER localization, as presented by Bader et al. at ISMRM 2025 (
https://archive.ismrm.org/2025/0601.html). This enables true 3D coverage with substantially smaller voxels, i.e., 0.24 mL vs 1.5 ml (this study) and more flexible regional averaging, which should markedly reduce partial-volume effects and provide much better spatial specificity than the 2D acquisition used in the present proof-of-concept study. Together with higher-field approaches such as 7 T and complementary 31P MRS/MRSI, we think this opens several very interesting possibilities for studying cerebral energy metabolism in ME/CFS. Our groups already have substantial experience with these techniques; the major practical requirement for taking them into larger patient studies is securing the necessary funding.
Thanks again for the thoughtful discussion, these are very useful methodological points to clarify.




 @NiFab and