Preprint Experimental hypoxia to probe neuro-metabolic and vascular dysregulation in ME/CFS: a multimodal proof-of-concept MRI study, 2026, Bader et al.

Now, when exposed to the simulated hypoxic conditions, the Lac/tCr ratio increases less than healthy controls, this could mean there is a lesser capacity for additional compensatory glycolysis to be generated in further hypoxic conditions. Considering the lactate is elevated at rest, this seems sensible to me.
What do you suppose could have cause n-acetylaspartate to rise?

Healthy controls switch to glycolysis with PKM2 tetramer while patients have been processing with PKM2 dimer all along. What would adding that into the picture mean?
 
Hi everyone,


I'm Lukas Haider, senior author on this preprint. Thank you to SNT Gatchaman for the careful, generous summary. It's a more thorough read than most papers get in peer review, and thanks also to everyone who has taken the time to look at the figures properly! Several of the points raised here are ones we'll address in the revision, so this is genuinely useful to us.


A word on what this study was and wasn't designed to be. It was funded as high-risk, first-line proof-of-concept work in a 12-month timeframe and on that we delivered. That funding line exists to test whether an idea is worth pursuing at all, and it constrains what is achievable. A single site, a single scanner, a single session per participant, and a cohort in the twenties are what that envelope buys. We designed the study to answer one question, namely whether a controlled hypoxic challenge combined with multimodal MRI is feasible in this patient group and whether it produces signals worth chasing. We think it does, and the study delivered on that remit. It is explicitly hypothesis-generating. It is not a definitive, multicentre, adequately powered study, and nothing in it should be read as one. I mention this not to deflect the criticisms below, several of which I think are correct on their own terms, but because I'd rather the scope be clear than have the paper judged against a design it was never funded to be.


On the lactate figure (#14, #17): ScoutB is right. Fig. 2c shows a single representative control and a single representative patient, chosen to illustrate the pattern, not to demonstrate the group effect. It was a mistake on our part to lead with it, because it invites exactly the reading Jonathan Edwards made. The group data are in Fig. 5.


On heterogeneity (#18): I think this is a fair reading of Fig. 5 and I don't want to argue it away. The patient distribution does overlap the controls substantially, the baseline difference in thalamic Lac/tCr is modest (0.171 vs 0.135), and the variance in the patient group is markedly higher. We quantified this (patient-to-control variance ratios up to 6.94 for the CBF response, FDR-p = 0.001), but a variance ratio describes the spread; it doesn't establish that the group mean reflects a shared mechanism. With 21 patients and 15 controls in the analysed spectroscopy sample, we cannot distinguish "a modest shift in most patients" from "a subgroup with a marked abnormality, plus a majority who look like controls." That distinction matters a great deal, since it is the difference between a disease-level finding and a stratification marker, and it needs a larger cohort to settle. I'd rather say that plainly than defend a stronger claim.


On whether the hypoxic challenge added anything (#7): the baseline lactate elevation is the most concrete result and is consistent with prior work. The intended readout of the challenge was the absence of a further rise in patients where controls rose. But a null in a group of this size is weak evidence, and we should be explicit in the revision that we cannot exclude power rather than a ceiling effect as the explanation.


On the baseline control lactate looking high (#6): this is a good catch and deserves a proper answer rather than a summary from me. Our spectroscopy specialists will post a separate reply on the MRS acquisition and fitting, which is their area rather than mine. In the meantime, the short version: we used a 2D semi-LASER CSI sequence at TE = 135 ms (TR 1700 ms, 16×16 matrix, FOV 160×160×15 mm, VOI 80×80×15 mm, 3 averages). The long echo time was chosen deliberately for lactate, since at TE 135 the doublet is inverted at 1.3 ppm and macromolecule and short-T2 lipid signal has largely decayed, leaving that region cleaner than at short TE. Fitting was done in LCModel v6.3 against a simulated 19-metabolite basis set, with ROI averaging before fitting to compensate for low voxel-wise SNR.


Two things I'd flag ahead of their reply. At TE 135 the lactate doublet is J-modulated, so absolute Lac/tCr from this sequence is not directly comparable to short-TE or differently implemented acquisitions, and the apparent height in Fig. 2c is exaggerated by the magnified inset. And with a nominal in-plane voxel of 10×10 mm, point spread function contributions from structures neighbouring the thalamus, including ventricular CSF, cannot be entirely excluded despite the partial-volume correction. That would affect both groups rather than generate the difference, but it is a plausible reason the absolute level looks higher than expected in healthy brain.


On the hypocapnia confound (#5): this is the methodological point SNT Gatchaman has identified correctly. We used poikilocapnic normobaric hypoxia, so ventilatory CO₂ washout is a real competing influence on CBF, acting opposite to hypoxic vasodilation. We did not measure CO₂. MR-compatible capnography was not feasible within the field constraints of our setup, and the alternative of serial blood gases would have meant repeated sampling during a 45-minute protocol in a patient group for whom we were explicitly trying to minimise burden. That was a deliberate trade-off, but it is a limitation and it is not sufficiently stated as such in the preprint. We will add it. The two-stage design over roughly 30 minutes was intended to allow partial ventilatory acclimatisation, but that is an assumption we did not verify. I'd go further: unmeasured inter-individual variation in the ventilatory response to hypoxia is itself a candidate explanation for part of the CBF variance we report, and we cannot currently separate it from a primary vascular difference. Isocapnic hypoxia, or at minimum end-tidal monitoring, belongs in any follow-up.


Sean's point about BOLD and oxygen metabolism (#10) is less directly applicable here, since ASL quantifies perfusion rather than deoxyhaemoglobin. But the underlying caution, that a haemodynamic signal is not a metabolic one, applies to our CBF measures too.


On the CFQ (#4): point taken. It was included for comparability with the existing literature rather than because we think it captures what matters in ME/CFS, and the correlation analyses using it are exploratory at best. We'd welcome suggestions on instruments this community considers more fit for purpose.


On the 7T suggestion: agreed, and that's where we'd like to go, with combined ¹H and ³¹P at higher field and larger, better-characterised cohorts. There is more to learn than whether lactate is up. Whether we get there depends on securing the kind of funding that a proof-of-concept grant is meant to unlock, which is part of why this preprint exists.


For transparency on affiliations and support: my primary post is at the Medical University of Vienna, and I hold a research affiliation with UCL Queen Square Institute of Neurology. The study is an international collaboration including colleagues in Amsterdam who brought the ASL expertise. It was supported by the WE&ME Foundation and the Vienna Science and Technology Fund (WWTF). This is in the acknowledgements of the preprint and will be more prominent in the final version.


Happy to answer further methodological questions!


Many thanks and best wishes,

Lukas

Thanks for this, great to have you here! What I’d be especially interested in is what you envision as the logical follow-up study using the 7 Tesla machine.

If you could design that study more or less as you would like, what would it look like? Roughly how many patients and controls would you include, would it be single-center or multi-center, what would the study design be, and what kind of budget would roughly be required?

I’m mainly trying to understand the scale of the study you think would be scientifically compelling but still realistically fundable.
 
Hi and welcome Lukas! It’s great to have you here.
On the CFQ (#4): point taken. It was included for comparability with the existing literature rather than because we think it captures what matters in ME/CFS, and the correlation analyses using it are exploratory at best. We'd welcome suggestions on instruments this community considers more fit for purpose.
What kind of info do you want to get from the questionnaires?

Most are seriously flawed and I doubt they will be able to add much of any value.

FUNCAP can give you some pointers about their functional capacity, which could be a proxy for disease severity. It has subscales for communication, concentration and reaction to sound and light, so if might be possible to use it for explorative analyses comparing cognitive vs «physical» impairment.
 
Thanks for the engagement, @LuHa.
I am a bit distracted with issues other than science at present and am dipping in to things a bit superficially. Your responses are very reassuring - I think this was an intelligent study and it sounds as if your interpretation is very nuanced. Good stuff.

Look forward to the final publication.
 
Welcome, @LuHa, and thanks for responding to our comments.

FUNCAP can give you some pointers about their functional capacity, which could be a proxy for disease severity. It has subscales for communication, concentration and reaction to sound and light, so if might be possible to use it for explorative analyses comparing cognitive vs «physical» impairment.

Definitely a better instrument than the CFQ, though I understand the authors' use of it for comparability. If screening is part of the exercise, the DecodeME questionnaires might serve as a guide.
 
Some context for why the questionnaires are not suitable for ME/CFS research:
The German version of the SF-36 32,33 physical activity subscale was used to assess participants’ health limits. Activities ranging from washing and dressing to walking short and long distances, and even running, were performed during a typical day, and participants were asked to indicate whether they were limited a lot, a little, or not at all. The scores for the ten questionnaire items were transformed into a scale ranging from 0 to 100%, where higher scores indicate a better physical condition and lower scores indicate a worse condition.
The SF-36 asks if you can do something. In ME/CFS the issue is rarely if you can do something, but the impact of doing it or the cumulative impact of doing many things. Therefore, SF-36 tends to overestimate the functional capacity of people with ME/CFS.
Severity of chronic fatigue was assessed using the German version of the Chalder Fatigue Scale (CFQ)34,35. The 11-item CFQ is a brief screening instrument that can be used for epidemiological and clinical purposes. The abbreviation CFQ is commonly used to distinguish it from CFS. The scoring procedure of the instrument allows to differentiate between no fatigue and severe fatigue with an additional item to assess chronicity.
The CFQ suffers from content/construct validity. While it might correlate with other so-called fatigue scales, that’s because the other scales also suffer from the same flaws.

S4ME wrote a detailed critique of it back in 2018.

If larger studies are planned, I think a better option would be to use FUNCAP as explained above, but also to use objective measurements of cognitive functioning if you want to contextualise the level of functioning relative to others.
 
Hi everyone,


I'm Lukas Haider, senior author on this preprint. Thank you to SNT Gatchaman for the careful, generous summary. It's a more thorough read than most papers get in peer review, and thanks also to everyone who has taken the time to look at the figures properly! Several of the points raised here are ones we'll address in the revision, so this is genuinely useful to us.
Hi and welcome! I have nothing scientific to add, but I wanted to say that I am very happy to see you join us on here. It always makes me happy to see researchers come talk with us. I hope you stick around!
 
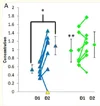
Thalamic lactate-to-creatine (Lac/tCr) ratios increased with hypoxia in controls (FDR-p = 0.028) but were already elevated at normoxia in patients (0.171 vs. 0.135; FDR-p = 0.021) and did not rise further (FDR-p = 0.38).
Possibly a similar finding in the following paper of CSF lactate not increasing after exercise in ME/CFS (though note that the pre-exercise and post-exercise groups are different individuals). I haven't read the paper in detail though.

Exertional Exhaustion [PEM] Evaluated by the Effects of Exercise on [CSF] Metabolomics–Lipidomics and Serine Pathway in [ME/CFS], 2025, Baraniuk
Lactate was predicted to be elevated in ME/CFS based on molecular spectroscopy studies of ventricular fluid [123,124,125,126], elevated resting plasma levels [127], and potentially by diffusion into cerebrospinal fluid after exercise such as cardiopulmonary exercise stress testing which increases plasma lactate levels [128]. SC [sedentary controls] had an increase after exercise (Figure 8B) but there were no changes for ME/CFS.
 
Possibly a similar finding in the following paper of CSF lactate not increasing after exercise in ME/CFS
Here's another similar finding in gulf war illness (GWI), which has similarities to ME/CFS: Prefrontal lactate predicts exercise-induced cognitive dysfunction in Gulf War Illness (Rayhan et al., 2013)

They don't show a comparison with healthy controls, but instead compared lactate between GWI subgroups: those who had an increase in a cognitive test score when comparing before to after exercise, and those who had a decrease (so maybe the latter is something like PEM).

The increasers (blue triangles below) started off with low lactate before exercise, and it increased after exercise. The decreasers (green squares) started off with high lactate and it remained high.

1786980093337.webp
 
Hi everyone,

I am Fabian Niess, one of the authors involved in the spectroscopy part of the study. Thanks for the careful discussion and, in particular, for raising the question about the relatively prominent lactate signal in the representative healthy-control spectrum. Lukas already gave the short answer, but I wanted to add a little more spectroscopy detail.

The appearance of an MR spectrum depends quite strongly on the acquisition parameters. In our study, we used a semi-LASER MRSI sequence at 3 T with TE = 135 ms. This relatively long echo time was chosen deliberately to improve specificity for lactate. Around this TE, the lactate resonance at approximately 1.3 ppm is strongly J-modulated and appears inverted. At the same time, much of the short T2 macromolecular and lipid background has decayed. Semi-LASER localization also restricts the excited volume to a central volume of interest, helping to reduce contamination from extracranial lipids.

For this reason, the lactate signal in Figure 2c should not be compared directly by eye with a conventional short-TE spectrum. Peak height is also not equivalent to metabolite concentration. At TE = 135 ms, the relative appearance of lactate and creatine is influenced by their different relaxation properties as well as the J-evolution of lactate. Creatine is substantially attenuated at this echo time, which contributes to lactate appearing relatively prominent. The inverted signal and relatively flat surrounding baseline are also reassuring with regard to lipid contamination, although residual contamination cannot be completely excluded.

As an additional sidenote, the spectra in Figure 2 are representative individual examples rather than group averages. For the healthy control shown there, the estimated lactate concentration was approximately 0.71 mM during normoxia and 1.55 mM during hypoxia. In the representative ME/CFS patient, lactate was approximately 1.25 mM and remained essentially unchanged with hypoxia. Thus, the visual difference reflects the intended example: a clear hypoxia-induced lactate increase in this particular control versus an already elevated and comparatively unchanged value in the patient. The group-level statistical results are shown separately in Figure 5.

Importantly, these concentrations in mM are only approximate estimates. Converting the measured Lac/tCr signal into an absolute concentration requires several assumptions, including the underlying creatine concentration and relaxation effects. The resulting values should therefore be interpreted with considerable caution and are mainly useful as a plausibility check rather than as formal absolute quantification. This is also why we chose to report the spectroscopy results as Lac/tCr ratios, which remain closer to what was directly measured and require fewer assumptions. Nevertheless, values on the order of ~1 mM of our healthy cohort are compatible with reported healthy-brain lactate concentrations.

Another question concerned why the characteristic lactate doublet is not clearly resolved into two separate components. At 3 T, their separation is relatively small compared with the achievable spectral linewidth. Residual B0 inhomogeneity, relatively large spectroscopic voxels and regional averaging can therefore cause the components to merge into a broader inverted feature. Thus, not seeing two clearly separated minima does not by itself argue against the signal being lactate.

This also highlights an important limitation of the present proof-of-concept study: we used a single-slice, 2D phase-encoded MRSI acquisition with relatively large nominal voxels (~1.5 mL), so point-spread and partial-volume effects are relevant and some contribution from surrounding tissue or ventricular CSF cannot be completely excluded.

For future studies, however, there is considerable room for a methodological step forward. Our group developed accelerated 3D MRSI using non-Cartesian concentric-ring-trajectory (CRT) encoding, which can replace the slow conventional phase encoding used here and allows for much more efficient spatial-spectral sampling and significant acceleration. We adapted this concept specifically for lactate by combining 3D CRT encoding with semi-LASER localization, as presented by Bader et al. at ISMRM 2025 (https://archive.ismrm.org/2025/0601.html). This enables true 3D coverage with substantially smaller voxels, i.e., 0.24 mL vs 1.5 ml (this study) and more flexible regional averaging, which should markedly reduce partial-volume effects and provide much better spatial specificity than the 2D acquisition used in the present proof-of-concept study. Together with higher-field approaches such as 7 T and complementary 31P MRS/MRSI, we think this opens several very interesting possibilities for studying cerebral energy metabolism in ME/CFS. Our groups already have substantial experience with these techniques; the major practical requirement for taking them into larger patient studies is securing the necessary funding.

Thanks again for the thoughtful discussion, these are very useful methodological points to clarify.

 
How awesome it is to have two authors on here! Thank you for coming to talk to us.
Our groups already have substantial experience with these techniques; the major practical requirement for taking them into larger patient studies is securing the necessary funding.
I don’t know how much funding you are talking about and what timeline you are thinking of, but I still would like to make you aware of this current funding opportunity in the ME/CFS field by WE&ME. It’s the main funding opportunity we have right now.

Whether you apply for this one or not, I hope you continue to study us. Neuroimaging studies like yours are so important and I hope to see more from your team.
 
I am wondering why you normalised to creatine, that isn't particularly static. In transcriptomics the usual normalising genes actually make things worse (!)

O'Hagan, S., Wright Muelas, M., Day, P. J., Lundberg, E. and Kell, D. B. (2018) GeneGini: assessment via the Gini coefficient of reference ‘‘housekeeping’’ genes and diverse human transporter expression profiles Cell Syst. 6, 230-244. https://doi.org/10.1016/j.cels.2018.01.003

Wright Muelas, M., Mughal, F., O’Hagan, S., Day, P. J. and Kell, D. B. (2019) The role and robustness of the Gini coefficient as an unbiased tool for the selection of Gini genes for normalising expression profiling data Sci Rep. 9, 17960. https://doi.org/10.1038/s41598-019-54288-7

We have just had accepted the equivalent for metabolomics, which glutamine wins by a country mile. The preprint is at

Kell, D. B., Dunn, W. B., Winder, C. L., Anand, K., Greenfield, B., Kenny, L. C., Merriel, A., Moore, J. B. and Waitt, C. (2026) The Gini coefficient as a surrogate for the regulability or homeostasis of metabolite concentrations: focus on ergothioneine. https://www.researchsquare.com/article/rs-10057852/v1

Wonder if you'd have seen something e.g. for lactate if you did?
 
Back
Top Bottom