Office of National Statistics: Prevalence of ongoing symptoms following coronavirus (COVID-19) infection in the UK: Updates

Discussion in 'Long Covid news' started by Andy, Jun 4, 2021.

  1. John Mac

    John Mac Senior Member (Voting Rights)

    Messages:
    1,006
    Prevalence of ongoing symptoms following coronavirus (COVID-19) infection in the UK: 3 November 2022

    • An estimated 2.1 million people living in private households in the UK (3.3% of the population) were experiencing self-reported long COVID (symptoms continuing for more than four weeks after the first confirmed or suspected coronavirus (COVID-19) infection not explained by something else) as of 1 October 2022; these estimates are only fully comparable with those in the October 2022 bulletin, when prevalence was 2.3 million, and not with any other previous bulletins because of changes in data collection methods.

    • Of people with self-reported long COVID, 262,000 (12%) first had (or suspected they had) COVID-19 less than 12 weeks previously, 1.8 million people (83%) at least 12 weeks previously, 1.1 million (50%) at least one year previously and 507,000 (24%) at least two years previously.

    • Of people with self-reported long COVID, 641,000 (30%) first had (or suspected they had) COVID-19 before Alpha became the main variant; this figure was 257,000 (12%) in the Alpha period, 395,000 (19%) in the Delta period and 749,000 (35%) in the Omicron period.

    • Long COVID symptoms adversely affected the day-to-day activities of 1.6 million people (73% of those with self-reported long COVID), with 333,000 (16%) reporting that their ability to undertake their day-to-day activities had been "limited a lot".

    • Fatigue continued to be the most common symptom reported as part of individuals' experience of long COVID (70% of those with self-reported long COVID), followed by difficulty concentrating (45%), shortness of breath (42%) and muscle ache (42%).

    • As a proportion of the UK population, the prevalence of self-reported long COVID was greatest in people aged 35 to 69 years, females, people living in more deprived areas, those working in social care, those aged 16 years or over who were not working and not looking for work, and those with another activity-limiting health condition or disability.

    • The estimates presented in this analysis relate to self-reported long COVID, as experienced by study participants who responded to a representative survey, rather than clinically diagnosed ongoing symptomatic COVID-19 or post-COVID-19 syndrome in the full population.
    https://www.ons.gov.uk/peoplepopula...onaviruscovid19infectionintheuk/3november2022
     
    Binkie4, sebaaa, ahimsa and 9 others like this.
  2. Simon M

    Simon M Senior Member (Voting Rights)

    Messages:
    995
    Location:
    UK
    So, we are now up to 333,000 people reporting their daily activities have been “limited a lot“.

    It wasn’t so long ago this was around 230,000.

    Approximately 600,000 people have had long Covid for between one and two years, and half a million have had it for two years or more.

    What would be helpful is some kind of decay curve, comparing long Covid cases with the relevant number of Covid cases that preceded it.

    Strengths and weaknesses.
    the study is based on 225,000 responses from a weighted sample. All data is collected remotely (online and phone). This makes it hard to compare with previous studies which use a lot of face-to-face data collection.

    It appears to be a cohort study, tracking, the same group of people over time.

    Like all household surveys, not every invited, household enrols and people are likely to drop out over time.

    They will be bias if non-enrolment and dropout is related to long Covid status. For instance, it’s quite possible that people with long Covid are more likely to stay in the studies than those who return to full health (health state studies generally are biased towards the less healthy, I believe).

    equally, people are asked if they have long Covid, and it’s likely many people are not familiar with the term so don’t know they have it and then don’t report it.

    Additionally, people may have had Covid without realising it and so be unaware that they now have long Covid.

    if the ONS stick with this methodology, it should be possible to more consistently track the illness over time.
     
    MEMarge, sebaaa, Midnattsol and 10 others like this.
  3. CRG

    CRG Senior Member (Voting Rights)

    Messages:
    1,860
    Location:
    UK
    Dataset | Published 3 November 2022
    Estimates of the prevalence and characteristics of people with self-reported long COVID and associated activity limitation, using UK Coronavirus (COVID-19) Infection Survey data


    xslx file = Estimates of the prevalence of self-reported long COVID and associated activity limitation, using UK Coronavirus (COVID-19) Infection Survey data.

    Estimated number of people (in thousands) living in private households with self-reported long COVID who first had (or suspected they had) COVID-19 at least 12 weeks previously, UK: four week period ending 01 October 2022


    Age group 2 to 11 28
    Age group 12 to 16 50
    Age group 17 to 24 113
    Age group 25 to 34 220
    Age group 35 to 49 515
    Age group 50 to 69 654
    Age group 70+ 201
    Sex Male 734
    Sex Female 1,046

    Sample sizes for estimates of the prevalence of self-reported long COVID, UK: four week period ending 01 October 2022

    All people 226,223
    Age group 2 to 11 14,033
    Age group 12 to 16 13,587
    Age group 17 to 24 9,087
    Age group 25 to 34 3,831
    Age group 35 to 49 43,264
    Age group 50 to 69 84,371
    Age group 70+ 48,050
    Sex Male 104,317
    Sex Female 121,906
    -----------------------------------------------------------------

    Reporting of LC in the UK does not seem to meet the characteristics of what is commonly presented as a typical ME/CFS population - e.g onset prior to age 50, M/F = 1/3 etc. Until there is much better characterisation of the LC population it's going to be difficult to make much sense of what a report of LC actually means, and only then might we be able to have any idea how LC relates to ME/CFS.
     
    ukxmrv, RedFox, Robert 1973 and 2 others like this.
  4. Peter Trewhitt

    Peter Trewhitt Senior Member (Voting Rights)

    Messages:
    4,081
    Until we can divide out what aspects of Long Covid relate to one off damage, such as lung damage, arising during the acute phase and what aspects relate to the triggering of an ongoing pathology, presumably ME/CFS, it is very difficult to interpret such figures in comparison to what we might expect for ME/CFS.
     
    sebaaa, MEMarge, ukxmrv and 6 others like this.
  5. Andy

    Andy Committee Member

    Messages:
    23,034
    Location:
    Hampshire, UK
    Half a million more people are out of the labour force because of long-term sickness

    "Comparing Quarter 2 (April to June) in both 2019 and 2022, the number of people inactive because of long-term sickness who reported their main health condition as “other health problems or disabilities” rose by 97,000 (41%), the largest of any category.

    Survey respondents were not given explicit guidance on what main health condition to report for coronavirus-related illnesses such as long COVID. As a result, those with long COVID are unlikely to all fall into one category, having reported the one that relates most closely to their main symptoms. It is likely that “other” would be a common choice because it includes similar conditions to long COVID such as post-viral fatigue syndrome. However, it is unlikely that COVID-19 is a main contributor to the increases seen in recent years. This is because the biggest year-on-year increase was seen between 2019 and 2020, which only covers the very early stages of the pandemic.

    According to Office for National Statistics (ONS) data on long COVID in the UK, around 0.8% of those who were economically inactive in the four weeks to 3 September 2022 also reported that they had long COVID that was limiting their life a lot. This is equivalent to around 75,000 people, according to labour market figures covering June to August 2022."

    https://www.ons.gov.uk/employmentan...bourforcebecauseoflongtermsickness/2022-11-10
     
  6. CRG

    CRG Senior Member (Voting Rights)

    Messages:
    1,860
    Location:
    UK
    Binkie4, Peter Trewhitt and Trish like this.
  7. rvallee

    rvallee Senior Member (Voting Rights)

    Messages:
    13,659
    Location:
    Canada
    Countries with a functioning state know close to the exact amount of pigs, cows and land being used for crops. And a bunch of other things that most people don't really know why anyone tracks that data. Because knowing if people are going to run out of food is very important, anarchy is always only about 9 empty meals away. Censuses are one of the most important function governments do, they are often mandated by law, it's a legal requirement to answer accurately, and interfering in its process is generally a serious felony. Because most policy and administrative decisions are made based on numbers, if you don't count something, you can't do much about it.

    And closing in on 3 years of this and not a single government has any interest tracking how many people have seen their health deteriorate as a result of a global pandemic. They simply don't want to know, because this is not something that counts for them. It's basically what it means to say that something "counts": it's worth counting, even one-by-one to be sure.

    Beyond absurd. It's becoming apparent that health may be one of the things we actually do the worst of all. Medical and public health authorities don't want to know, and this is who governments listen about what's worth tracking. It's frankly becoming a crisis that threatens our survival. If there is a pandemic happening soon that meets the worst-case scenario, likely a flu virus, we are completely screwed, almost all measures to deal with it have been made politically impossible to happen again. We are flying into this completely blind because of widespread systemic ineptitude.

    Well, almost completely blind. If it wasn't for social media, it would be a complete void. Reality turned on its head.
     
    BrightCandle and Peter Trewhitt like this.
  8. BrightCandle

    BrightCandle Senior Member (Voting Rights)

    Messages:
    341
    What the ONS has done here is really quite amazing for exposing the problem. Its even more astonishing that the government has repeatedly tried to force them to stop publicly. This goes well beyond just avoiding counting it but intentionally suppressing the estimate that is happening. The fact its not just the UK government but governments around the globe and more than that no healthcare system on the planet is bothering to count this is just unbelievable. The entirety of medicine and governments are willfully suppressing news that Covid is causing long term disability. History will be written about that!
     
  9. John Mac

    John Mac Senior Member (Voting Rights)

    Messages:
    1,006
    Prevalence of ongoing symptoms following coronavirus (COVID-19) infection in the UK: 1 December 2022
    Estimates of the prevalence of self-reported long COVID and associated activity limitation, using UK Coronavirus (COVID-19) Infection Survey data. Experimental Statistics.

    Release date: 1 December 2022

    • An estimated 2.2 million people living in private households in the UK (3.4% of the population) were experiencing self-reported long COVID (symptoms continuing for more than four weeks after the first confirmed or suspected coronavirus (COVID-19) infection that were not explained by something else) as of 6 November 2022 (see Figure 1).
    • Of people with self-reported long COVID, 187,000 (9%) first had (or suspected they had) COVID-19 less than 12 weeks previously, 1.9 million people (87%) at least 12 weeks previously, 1.2 million (55%) at least one year previously and 594,000 (27%) at least two years previously.
    • Of people with self-reported long COVID, 657,000 (30%) first had (or suspected they had) COVID-19 before Alpha became the main variant; this figure was 283,000 (13%) in the Alpha period, 386,000 (18%) in the Delta period and 764,000 (35%) in the Omicron period.
    • Long COVID symptoms adversely affected the day-to-day activities of 1.6 million people (75% of those with self-reported long COVID), with 370,000 (17%) reporting that their ability to undertake their day-to-day activities had been “limited a lot”.
    • Fatigue continued to be the most common symptom reported as part of individuals’ experience of long COVID (70% of those with self-reported long COVID), followed by difficulty concentrating (48%), shortness of breath (46%) and muscle ache (45%).
    • As a proportion of the UK population, the prevalence of self-reported long COVID was greatest in people aged 35 to 69 years, females, people living in more deprived areas, those working in social care, those aged 16 years or over who were not working and not looking for work, and those with another activity-limiting health condition or disability.
    • The estimates presented in this analysis relate to self-reported long COVID, as experienced by study participants who responded to a representative survey, rather than clinically diagnosed ongoing symptomatic COVID-19 or post-COVID-19 syndrome in the full population.
    https://www.ons.gov.uk/peoplepopula...onaviruscovid19infectionintheuk/1december2022

     
    Binkie4, MEMarge, RedFox and 5 others like this.
  10. CRG

    CRG Senior Member (Voting Rights)

    Messages:
    1,860
    Location:
    UK
    Simon M and Peter Trewhitt like this.
  11. CRG

    CRG Senior Member (Voting Rights)

    Messages:
    1,860
    Location:
    UK
    Peter Trewhitt likes this.
  12. John Mac

    John Mac Senior Member (Voting Rights)

    Messages:
    1,006
    Prevalence of ongoing symptoms following coronavirus (COVID-19) infection in the UK: 5 January 2023
    Estimates of the prevalence of self-reported long COVID and associated activity limitation, using UK Coronavirus (COVID-19) Infection Survey data. Experimental Statistics.

    1.Main points

    • An estimated 2.1 million people living in private households in the UK (3.3% of the population) were experiencing self-reported long COVID (symptoms continuing for more than four weeks after the first confirmed or suspected coronavirus (COVID-19) infection that were not explained by something else) as of 4 December 2022.

    • Of people with self-reported long COVID, 191,000 (9%) first had (or suspected they had) COVID-19 less than 12 weeks previously, 1.9 million people (87%) at least 12 weeks previously, 1.2 million (57%) at least one year previously and 645,000 (30%) at least two years previously.

    • Of people with self-reported long COVID, 637,000 (30%) first had (or suspected they had) COVID-19 before Alpha became the main variant; this figure was 251,000 (12%) in the Alpha period, 382,000 (18%) in the Delta period and 778,000 (37%) in the Omicron period.

    • Long COVID symptoms adversely affected the day-to-day activities of 1.6 million people (76% of those with self-reported long COVID), with 389,000 (18%) reporting that their ability to undertake their day-to-day activities had been "limited a lot."

    • Fatigue continued to be the most common self-reported symptom of long COVID (71%), followed by difficulty concentrating (49%), shortness of breath (47%) and muscle ache (46%).

    • As a proportion of the UK population, the prevalence of self-reported long COVID was greatest in people aged 35 to 69 years, females, people living in more deprived areas, those working in social care, those aged 16 years and over who were not working and not looking for work, and those with another activity-limiting health condition or disability.
    • https://www.ons.gov.uk/peoplepopula...ronaviruscovid19infectionintheuk/5january2023
     
  13. Andy

    Andy Committee Member

    Messages:
    23,034
    Location:
    Hampshire, UK
    Prevalence of ongoing symptoms following coronavirus (COVID-19) infection in the UK: 2 February 2023

    1.Main points

    • An estimated 2.0 million people living in private households in the UK (3.0% of the population) were experiencing self-reported long COVID (symptoms continuing for more than four weeks after the first confirmed or suspected coronavirus (COVID-19) infection that were not explained by something else) as of 2 January 2023 (see Figure 1).

    • Of people with self-reported long COVID, 142,000 (7%) first had (or suspected they had) COVID-19 less than 12 weeks previously, 1.8 million people (89%) at least 12 weeks previously, 1.2 million (61%) at least one year previously and 687,000 (35%) at least two years previously.

    • Of people with self-reported long COVID, 612,000 (31%) first had (or suspected they had) COVID-19 before Alpha became the main variant; this figure was 251,000 (13%) in the Alpha period, 337,000 (17%) in the Delta period and 702,000 (36%) in the Omicron period.

    • Long COVID symptoms adversely affected the day-to-day activities of 1.5 million people (77% of those with self-reported long COVID), with 380,000 (19%) reporting that their ability to undertake their day-to-day activities had been "limited a lot".

    • Fatigue continued to be the most common symptom reported as part of individuals' experience of long COVID (71% of those with self-reported long COVID), followed by difficulty concentrating (52%), shortness of breath (48%) and muscle ache (47%).

    • As a proportion of the UK population, the prevalence of self-reported long COVID was greatest in people aged 35 to 69 years, females, people living in more deprived areas, those working in social care, those aged 16 years and over who were not working and not looking for work, and those with another activity-limiting health condition or disability.
    https://www.ons.gov.uk/peoplepopula...onaviruscovid19infectionintheuk/2february2023
     
    Binkie4, MEMarge, Hutan and 7 others like this.
  14. CRG

    CRG Senior Member (Voting Rights)

    Messages:
    1,860
    Location:
    UK
    I graphed the ONS data for self reported 12 weeks+ (top line) 12 months+ (mid line) and 24 months+ (lower line) from June 2021 to Jan 2023 - vertical bars = monthly figures. The <12 weeks figures are omitted as these are likely to be mostly short term churn.

    The most recent four months data were collected under different methodology so the full 21 month set is only representative but there are some interesting features. The steep increase in the 12 weeks+ number doesn't begin until after February 2022 and while an increase in the 12month+ number commenced in December 2021, unlike the 12 week+ number, the 12 month+ number flattened in the 3rd quarter of 2022. The pronounced dip for August 2022 followed by a very steep incline is likely a statistical blip affected by holidays.

    The change in methodology may explain the the flattening/decline in the 12 week+ and 12 month+ figures but as the 24 month+ figures show a continued incline, the methodology change may not have that great an impact.

    There have been suggestions that repeated infection is associated with increased PASC risk but unless there's substantial churn between the sub 12 months figures - i.e many people experiencing PASC but getting well again in under a year, the graph suggests it is more likely that the number of people who are vulnerable to PASC have already had COVID 19 exposure and that the total levels of chronicity are flat or even in decline.

    One area of significance may be the percentage relationship between the 12 week+ and 12month+ numbers, the latter reached 60% of the former in March 2022, and has not exceeded 66% in the following 11 months. In contrast the 24 month+ number (since April 2022) increased from 6% to 38% of the 12 weeks+ number which is approaching the 43% seen from June 2021 in the 12month+/12 weeks+ ratio. The February 2023 total for 24 month+ at 687,000 is almost exactly the same number of 12 month+ (685,000) reported for March 2022 suggesting that whatever the level of churn, those reporting PASC at 12 months post acute Covid, are likely to be reporting it at 24 months. So while the numbers reporting PASC may have peaked, those reporting PASC at 24 months+ is likely to continue to rise toward the 1.2 million level.


    upload_2023-2-3_13-11-46.png


    upload_2023-2-3_14-29-11.png
     
    Last edited: Feb 3, 2023
    Hutan, Sean, Peter Trewhitt and 2 others like this.
  15. CRG

    CRG Senior Member (Voting Rights)

    Messages:
    1,860
    Location:
    UK
  16. CRG

    CRG Senior Member (Voting Rights)

    Messages:
    1,860
    Location:
    UK
    Binkie4, Hutan and Peter Trewhitt like this.
  17. TiredSam

    TiredSam Committee Member

    Messages:
    10,557
    Location:
    Germany
    Who is looking after all these people with long covid? Could there be a large number of healthy employable people who have had to switch to becoming a carer, part or full-time, for a long covid sufferer?

    On another point, there has just been a report in the German news that actually there are as many people in employment now as there have ever been, but more of them are saying no to low paid jobs or poor working conditions. The example they gave was a hairdresser who couldn't get any applicants until she offered a 4-day week, then she was flooded.
     
    Binkie4, Arnie Pye, Ariel and 7 others like this.
  18. CRG

    CRG Senior Member (Voting Rights)

    Messages:
    1,860
    Location:
    UK
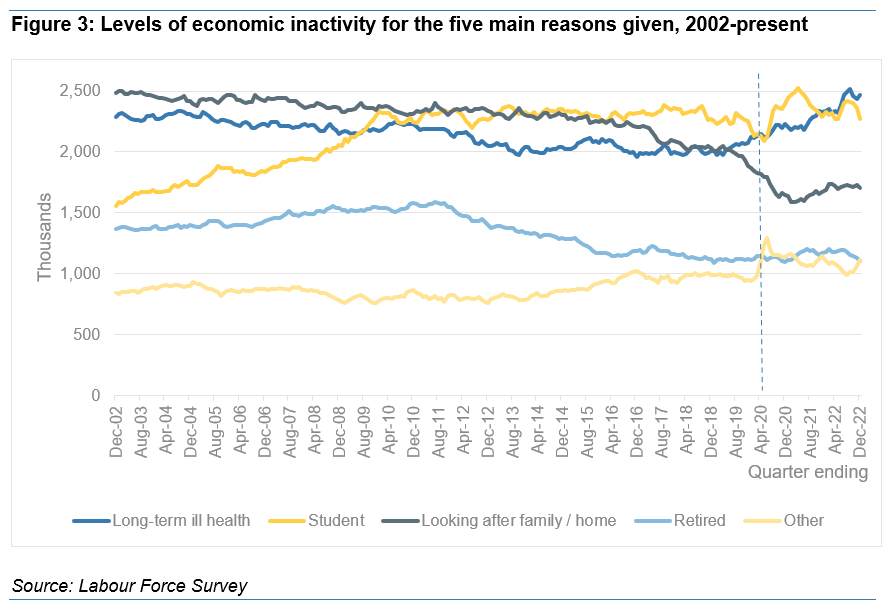
    As regards the UK, see fig 4 above; while the long term ill figure has increased by around 350,000, the number "looking after family/home" has fallen by 100,000+.

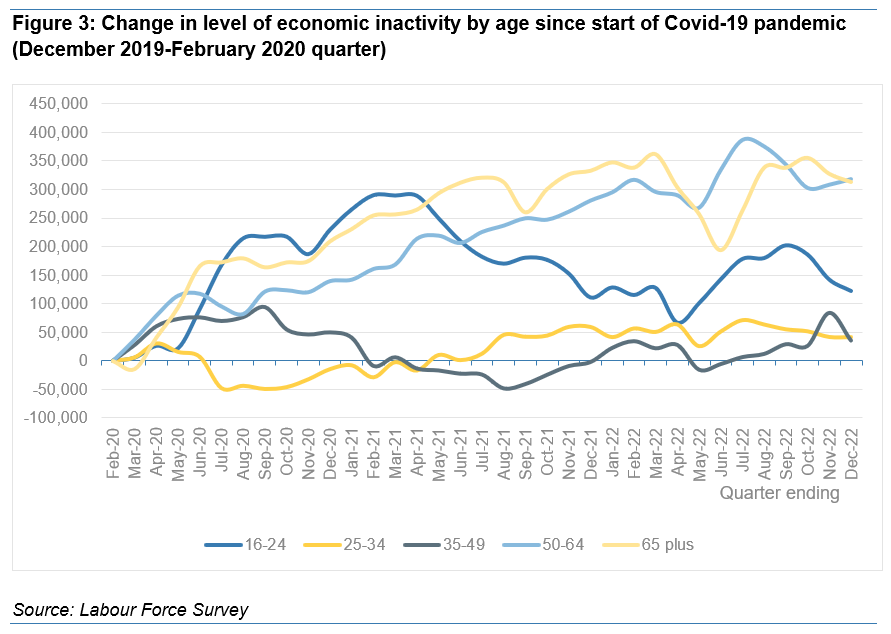
    By age the greatest increase in economic inactivity has been amongst the 50-64 age group (Fig 3a below) who may be as much affected by the the increase in NHS waiting times as by PASC. Despite the figures from the Long COVID survey showing large numbers affected, as yet these don't appear at the same levels in the employment data. This might be confirmation that PASC is being reported at higher frequencies amongst the already ill and/or 50+ than in younger, healthier cohorts.

    Figure 3a)

    [​IMG]
     
  19. CRG

    CRG Senior Member (Voting Rights)

    Messages:
    1,860
    Location:
    UK
    Actuarial view: Great Sickness?” – is the Government at risk of ‘barking up the wrong tree’ on the rise in economic inactivity ?

    "Initial commentary on these figures dubbed it a ‘Great Retirement’, suggesting that large numbers of older workers have chosen to opt out of paid work, living off their pensions, perhaps having enjoyed a slower pace of life during the Pandemic.

    But new research from pensions and health experts at consultancy LCP, questions whether this is the right explanation. They point out that the latest figures show that retirement explains *none* of the increase in inactivity since the start of the Pandemic. There are actually *fewer* people of working age who are retired now than there were at the start of the Pandemic."

    This is summarised in the chart below:

    [​IMG]
     
  20. rvallee

    rvallee Senior Member (Voting Rights)

    Messages:
    13,659
    Location:
    Canada
    Oops?

    To think that all of this, or at least the modern incarnation, was driven by the belief that it would be cost-effective. All it accomplished is to waste billions building up a pseudoscience so millions of lives get ruined at a cost of trillions. Brilliant work, geniuses. Although to be fair, who could have known that made-up stories and narratives built on 19th century myths aren't any good, even when you really strongly believe in them?

    It gets a lot of harder to be listened to as experts when you screw up majorly like this and never correct. Not to mention the moral bankruptcy, but that's clearly something that's part of human nature.
     

Share This Page