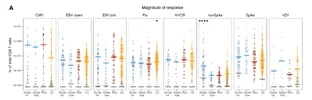
Okay, a couple things that stood out to me. So the plots in the main figures are for "activated CD8+ T cells", which they define as expressing at least 2 "activation markers" (the options were PD-1, CD38, CD39, Ki67, and HLA-DR).
Fig 2B:

When they look at all CD8s, there is no difference (Fig S3A):
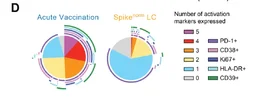
This figure, 2D, is meant to show the distribution of markers used to call "activated" status.

There's an additional supplemental (S6D) showing 2 more groups that were left out of the main figure:
"Spike (Act)" seems to be samples from above the dotted line in Fig 2B and "Spike (norm)" is below that line. But they kept all the recovered flattened together and splitting the LC groups this way makes it impossible to do a direct comparison on overall frequencies.
What I think is useful is to compare which activation markers are present in the acute infection condition vs. the LC samples. In all cases, the vast majority of T cells expressed PD-1 (dark purple)--that's a protein that gets upregulated once the T cell is activated and serves as a negative control mechanism (when PD-1 binds to PD-L1 it inhibits T cell responses) [edit: and usually stays upregulated through the life the T cell]
The main marker that seems to differentiate the Acute Infection condition from the LC samples is Ki67 (the dark blue)--this is a marker of proliferation and indicates that the T cell is undergoing active clonal expansion. That's virtually absent in either of the LC subsets. So really the main finding of this paper comes down to whether a T cell expressed sufficient CD38 or CD39 to be labeled as an "activated" T cell. That's where I'd really start to worry about batch effect skewing things. And there does seem to be a significant effect of recruitment site, per S6C and the plot
@ME/CFS Science Blog already posted:

They claim in the text that the difference in activated CD8+ T cells survived correction for age, sex, race and SARS-CoV-2 exposure. I guess they did not include recruitment site in the covariates. And the dotted line that they used to define "Spike (Act)/(Norm)" was the mean + 1SD for
all recovered samples.
So overall I'm seeing a lot of places where technical bias and the specifics of how things were labeled may be driving this signal that was quite small to begin with. I'm willing to accept that there might be a real signal buried underneath confounders. But if it is there, I have to anticipate it's very very small.



