Genetics: Chromosome 6 FBXL4, POU3F2/BRN2

Here are the results of my brief analysis of this locus (there's more about my methods and approach in the chr20 locus).

Credible set
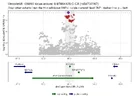
This region also had one credible set of 86 SNPs over a 180 kb. It’s in a gene desert, far removed from protein coding genes but lies in a long non-coding RNA called ENSG00000271860. It also includes another non-coding RNA called MIR2113.
1793122806615.webp
Chromatin
5 of the SNPS were in a regulatory region suggesting open chromatin. The biggest effects for DNAse results were for regulatory region EH38E4411500 which contains rs756671264. The chromatin here was most open in fetal brain samples.

Another one of these regulatory regions (EH38E2487665 containing rs7753937) had 3D contacts with promotor region of several genes. POU3F2 was the only protein-coding gene. Data came from Intact Hi-C in mammary epithelial cells (MCF 10A) though, not from brain samples.

1793122946243.webp

eQTL
In the more than 200 eQTL datasets I only found one with a high probability of having the same signal and it was a weak one linked with the non-coding RNA in the brain/amygdala. The ME/CFS risk allele lowers the IncRNA.

1793122961796.webp

Phewas
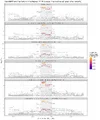
In the Phewas analysis of other genetic studies that found a similar signal here I got peculiar results. The large analyses BMI and intelligence signals in this region give PP. H3 0.8-0.99 which suggests that their main signals are driven by different variants. There were multiple dataset that had a similar signal but I can’t really make much sense out of the results. There doesn't seem to be a clear pattern.

1793123106475.webp

It looks like these are analyses from the the UK biobank dataset. Perhaps it points to some participation bias in the UK biobank or perhaps it’s just noise from scanning 50,000 GWAS looking for a signal. Plotting the data shows that the signal is often a bit different despite the high colocalization.
1793123359964.webp
 
The prioritzation of FBXL4 in the preprint seems to be mostly based on it being the closest gene. But it is not really close and the 3D chromatin data suggested a link with POU3F2 which is also the strongest brain-based protein coding gene nearby.

So my guess for this locus is that it points to an effect from POU3F2, possibly during fetal development. It is involved in how cortical neurons are wired but perhaps more interesting is its potential link to the hypothalamus and CRH: “POU3F2 encodes a POU domain transcription factor that acts in neuronal differentiation and activates corticotropin-releasing hormone regulated genes.”
https://www.genecards.org/card/POU3F2
 
“POU3F2 encodes a POU domain transcription factor that acts in neuronal differentiation and activates corticotropin-releasing hormone regulated genes.”

I like it.
I am all for taking note when amongst the utter confusion a jumble of letters pops up that supports a favourite scent, and ignoring it if it supports a spit-back. ;)
(Having spent the last few hours trying to piece together what all these hypothalamic mediators might be saying to each other.)
 
I agree, I think POU3F2 makes more sense.

This paper says that POU3F2 expression increases substantially in schizophrenia, though GWAS hits for schizophrenia didn't obviously point to it. It speculated in the discussion that some of the schizophrenia GWAS hits may be explained by variants in regulatory regions of POU3F2's downstream target genes, potentially making them less POU3F2-responsive.

Here the story seems to be a little different--the issue in ME/CFS might be whether/how much POU3F2 itself is responsive to something else that acts within that big regulatory region.
 
Last edited:
I couldnt quite parse if this is just during foetal development?
So the finding that BRN2 activates CRH transcription is in-vitro, not necessarily limited to fetal development. Though what they're showing in fetuses is that if you knock out BRN2 the mice don't have detectable CRH production in neurons (besides a rare few that get driven by BRN4). What they didn't test is whether BRN2 is required for all CRH transcription even [edit: in-vivo] after fetal development.
 
Last edited:
I agree, I think POU3F2 makes more sense.

This paper says that POU3F2 expression increases substantially in schizophrenia, though GWAS hits for schizophrenia didn't obviously point to it. It speculated in the discussion that some of the schizophrenia GWAS hits may be explained by variants in regulatory regions of POU3F2's downstream target genes, potentially making them less POU3F2-responsive.

Here the story seems to be a little different--the issue in ME/CFS might be whether/how much POU3F2 itself is responsive to something else that acts within that big regulatory region.
Just noting that per this paper, SOX6 is a known downstream target of POU3F2 (and is itself a transcription factor). SOX6 had a weak peak in DecodeME that didn’t quite reach the significance threshold. But this connection might provide more support that its a real, albeit weak, signal.
 
The FLAMES algorithm predicted MMS22L for this region with high confidence. But I think it's because FLAMES is restricted to a 750 kb window (filter = 7500000 in this file) so it didn't consider other genes such as POU3F2. It probably only saw MMS22L in the 750 kb window and gave it a high score due to lack of competitors.

Suggests that FLAMES might not be reliable if genes are far removed from the signal. It's not so much that it overlooked POU3F2 but also that it gave high probability to MMS22L which seems misleading.
 
Chromatin conformation
I've been looking more into databases on 3-D contact: based on how the chromatin is folded, locations that are far apart on the DNA string can actually be close. It is particularly useful when the GWAS signal is in a gene desert, far away from protein-coding genes.

The method that captures this info is called Hi-C (high-throughput chromatin conformation capture). It freezes DNA contacts with formaldehyde and then uses several trick that measure the regions that were physically close to each other.

Hi-C gives a matrix of measurements (position x is in contact with position y, etc) which takes up a lot of disk spaces. So I first screen the data with a summary measure that groups the genome into domains (using the Arrowhead method described in this paper). 3-D contacts happen mostly inside a domain, so if a gene and the credible set lie in the same domain that's an indication that influence each other. An enhancer usually regulates genes in its own domain.

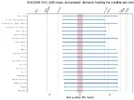
Encode has such 228 of such datasets from different cell types and tissues which I retrieved using the help of AI (In their API I used: output_type=mapping+quality+thresholded+contact+matrix&output_type=contact+domains"). The plot below shows the 27 of samples that have domeins through the credible set (indicated in red) and the brain samples. In the former credible set is often in the same domain with POU3F2 (and to a lesser extend FBXL4) on the right side.

1793705635467.webp

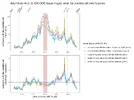
For the 5 brain samples I downloaded the raw data for this region and plotted the contacts that go from the credible set region to places outside it. You can see there's a peak at POU3F2, which is more pronounced in the second plot where I try to control for distance (observed contacts divided by the mean contact per distance = expected contacts).

1793704299078.webp

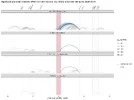
I tried to check with other datasets that use PLAC-seq. This is basically the Hi-C contacts but only those that are connected to active promotors (measured with histone marks such as H3K4me3). That makes the dataset smaller. I used the studies Cui et al. 2025 that used neurons generated from stem cells and Nott et al. 2019 which used several brain cells types. It also shows that these contacts that go from the credible set are most often linked with POU3F2.

1793704556563.webp

To clarify: none of these plots is hard evidence that the DecodeME hit implicates POU3F2 but it does give a little more confidence that this is the most plausible gene, despite being quite far away from the hit.
 
Chromatin conformation
I've been looking more into databases on 3-D contact: based on how the chromatin is folded, locations that are far apart on the DNA string can actually be close. It is particularly useful when the GWAS signal is in a gene desert, far away from protein-coding genes.

The method that captures this info is called Hi-C (high-throughput chromatin conformation capture). It freezes DNA contacts with formaldehyde and then uses several trick that measure the regions that were physically close to each other.

Hi-C gives a matrix of measurements (position x is in contact with position y, etc) which takes up a lot of disk spaces. So I first screen the data with a summary measure that groups the genome into domains (using the Arrowhead method described in this paper). 3-D contacts happen mostly inside a domain, so if a gene and the credible set lie in the same domain that's an indication that influence each other. An enhancer usually regulates genes in its own domain.

Encode has such 228 of such datasets from different cell types and tissues which I retrieved using the help of AI (In their API I used: output_type=mapping+quality+thresholded+contact+matrix&output_type=contact+domains"). The plot below shows the 27 of samples that have domeins through the credible set (indicated in red) and the brain samples. In the former credible set is often in the same domain with POU3F2 (and to a lesser extend FBXL4) on the right side.

View attachment 35062

For the 5 brain samples I downloaded the raw data for this region and plotted the contacts that go from the credible set region to places outside it. You can see there's a peak at POU3F2, which is more pronounced in the second plot where I try to control for distance (observed contacts divided by the mean contact per distance = expected contacts).

View attachment 35059

I tried to check with other datasets that use PLAC-seq. This is basically the Hi-C contacts but only those that are connected to active promotors (measured with histone marks such as H3K4me3). That makes the dataset smaller. I used the studies Cui et al. 2025 that used neurons generated from stem cells and Nott et al. 2019 which used several brain cells types. It also shows that these contacts that go from the credible set are most often linked with POU3F2.

View attachment 35060

To clarify: none of these plots is hard evidence that the DecodeME hit implicates POU3F2 but it does give a little more confidence that this is the most plausible gene, despite being quite far away from the hit.

Wow this looks really quite striking. I was under the impresssion for some reason that Hi-C has not proved such a useful datasource for some reason but it appears to point so resoundingly towards POU3F2 here. I'm very much enjoying your posts on this stuff @ME/CFS Science Blog. Do you think this technique might be helpful for the other loci too? I'm really not qualified to critique these fine mapping techniques but it does look fascinating.
 
Do you think this technique might be helpful for the other loci too?
Yes, I plan to do these analyses (eqtl, phewas, AlphaGenome, chromatin openness, Hi-C) on all DecodeME hits with p < 10^-6. Most of the time these analyzes don't give much extra insight, but sometimes they help refine the predictions of the FLAMES algorithm for what the most plausible causal gene is. The Hi-C data seems valuable when there is a lot of space between the credible set and genes.

It's all done by an amateur with the help of AI (retrieving the data is often the most complex part) so best to double-check if you plan to use something for your own research.

My goal is to get a list of genes that are likely implicated in ME/CFS, delve deep into what is know about their function and location and then see if there are any patterns that emerge. So it's a bit like fitting a puzzle knowing that you only have a handful of pieces and that 10-30% of them are wrong. But perhaps it might give a better view on what the end result will look like.
 
Last edited:
I was under the impresssion for some reason that Hi-C has not proved such a useful datasource for some reason but it appears to point so resoundingly towards POU3F2 here.
It tends to be an unusually noisy data type, and the methods used to analyze the data can have very outsized impact on results. Also from what I remember at round table presentations people have had a lot of difficulty doing it on fresh samples (you really need a large number of cells to screen out noise reliably). It makes comparisons between conditions [edit: or even cell types] very difficult. For something like this it might be alright if there’s a very strong signal above noise and the conclusion seems corroborated by other data types.
 
Last edited:
Great analysis @ME/CFS Science Blog

I think this does give extra confidence that the credible hit-dense region definitely does interact with POU3F2 in many cell types, though FBXL4 can’t be ruled out.

The main thing I’d be wary of is making conclusions about cell/tissue type specificity from Hi-C data since that’s going to be a circus of technical variability. Like I’d feel confident saying the region is in proximity to POU3F2 in iPSC derived neurons but I wouldn’t use this data to call a negative in other cell types
 
Back
Top Bottom