Preprint Seven replicated genomic associations of myalgic encephalomyelitis/chronic fatigue syndrome: a biobank study, 2026, Slaughter, Ponting et al.

I might be too foggy to write this coherently but taking a shot anyway..

As you increase GWAS size/power more and more loci tend to cross the significance threshold. The number of loci for schizophrenia has gone from around 100 to more than 200 over the last 10 years. I believe if a larger decodeME-style GWAS is run with carefully selected cases and controls, in the same demographics, the hope would be that the same loci from decodeME pop up with even smaller p-values, and new loci that didn't previously meet the threshold will be crossing it. Which is to say, there probably are other loci out there that matter enough to ME/CFS to take seriously, even if they don't matter quite as much as the first hits decode has found.

It seems... possible (no idea how likely) to me that this study pulled out loci from that larger pool. Nightsong also made a really good point up thread, that only selecting controls who reported good or excellent health (rather than just ordinary people without ME/CFS) could very well skew which variants most differ between cases and controls. No idea if that would be enough to completely overwhelm the ME/CFS signal we're interested in, or if it could just be shifting around which variants (of the larger set I'm imagining exists) turn up on top.

So I'm watching this with cautious interest. I think as we get more genetic data this stuff is likely to become much more clear.
 
I have to admit that I didn't really follow their explanation.
Oh thank God. My gratitude to @V.R.T. for bringing this up again is immense, as I had stopped responding earlier when it seemed most were satisfied and I didn't want to waste any more time. It's a relief to hear that I was not alone (and perhaps this should be a lesson not to stop questioning just because I start to feel awkward and stupid for not understanding).
 
Last edited:
Oh thank God. My gratitude to @V.R.T. for bringing this up again is immense, as I had stopped responding earlier when it seemed most were satisfied and I didn't want to waste any more time. It's a relief to hear that I was not alone (and perhaps a less not to stop questioning when things start to feel awkward).
I don't understand it either and am not convinced by what I've read on here.

Unfortunately, I'm too unwell to try to understand how each tool works which could point out to the reasons for discrepancies.

Is it even possible to benchmark and validate these tools? One can point out to the instances where these tools have identified genes or gene regions which turned out to be important and correct leads but is it possible to calculate sensitivity and specificity of the tools? NB: My questions don't come from a place of malice. FWIW the niche I worked in suffers from similar problems and you end up benchmarking your tools against other tools or comparing predictions against a set of predictions which were common for several established tools. But basically you never benchmark against an absolute biological truth because that's unknown.
 
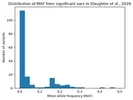
I still think it's worth verifying that the lead variants in this study aren't false positives. It very well may be real. But the pattern of over half of the originally significant variants having an MAF less than 0.02, and nearly all (6 out of 7) replicated variants having an MAF of right around 0.02, makes me wonder if there is some statistical bias of some sort.

I previously posted this, but here is the distribution of MAF for significant variants in this study again:
1793053669222.webp

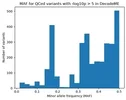
And the distribution of MAF for DecodeME, where it skewed towards common variants:
1793053637388.webp

I just did a quick search for some GWAS papers to look for any that have easily accessible data which includes allele frequencies for significant variants. Not a very systematic process, but also not cherry picked. These are the only ones I looked at where I could quickly find the MAFs:
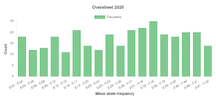
Genomic Architecture of Migraine: A Multi-ancestry GWAS Meta-analysis of 2.5 Million Participants (Overstreet 2026)

Minor allele frequencies from "Supplementary Table 3: Lead variants (N=311) identified in the meta-analysis of migraine (including 23andMe) in European ancestry participants"​
1793050953135.webp​

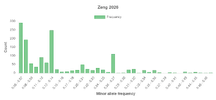
A latent genetic factor underlies multiple component phenotypes of cerebral small vessel disease (Zeng 2026)

eaf column from "Table S6. Genome-wide significant SNPs identified by multivariate GWAS of the cSVD latent factor."​
1793051008236.webp​

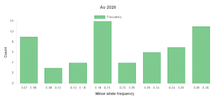
Exome-wide association study reveals common and rare coding variants shaping chronic pain in 327,642 UK biobank participants (Ao 2026)

MAF calculated from freq_geno column in Supplementary Table 6. Independent lead variants from GCTA-COJO analysis on variant-level ExWAS results and generalizability in non-European populations​
​
1793051355609.webp​

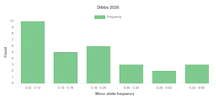
Genome-Wide Association Study of Pterygium Versus Pinguecula Identifies Loci Associated with Lesion-Type Divergence (Dibbs 2026)
​
MAF calculated from "A1_FREQ_CONTROL" in Table S2​
1793054386003.webp​

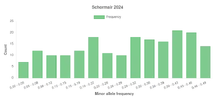
Genome-wide meta-analyses of restless legs syndrome yield insights into genetic architecture, disease biology and risk prediction (Schormair 2024)

MAF calculated from EAF in Table S1: "Lead SNPs of pooled meta-analysis "​
1793052199010.webp​

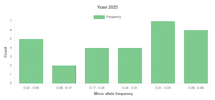
GWAS identifies genetic loci, lifestyle factors and circulating biomarkers that are risk factors for sarcoidosis (Yuan 2025)

MAF calculated from EAF in "Table 1 Genetic loci associated with sarcoidosis at the genome-wide significance level in the meta-analysis of Europeans and African Americans"​
1793052642635.webp​

Most of these have a relatively uniform distribution of allele frequencies for significant variants. A couple studies skewed a little towards rare variants, but still not as skewed as the thread study.

So I think it's worth doing something like testing for genomic inflation, maybe with LDSC (though I don't know if it works as well for stratified subsets of variants), at different allele frequency levels to see if there is increased inflation for rare variants. Or maybe seeing how the results compare to using a different algorithm, like regenie.

----

This is totally out of my wheelhouse, so it may be unrelated, but I wonder if the following snippet from the paper about TarGene (Labayle et al., 2025) has anything to do with the rare variant skew.

I have little idea what exactly they're talking about, but I notice that they note that they had unexpected results when analyzing the rarest trait, sarcoidosis. This trait happened to have right around the same sample size as the ME/CFS group in the thread study.
For single-variant effects, we selected five traits spanning a range of outcome types: leukocyte count, body mass index, sarcoidosis (rare, approximately 1,000 cases)
While of primary importance to researchers, coverage provides an incomplete view of an estimator’s performance. We additionally analyze the bias-variance decomposition across all estimation tasks. Squared bias, variance and mean-squared error are estimated via bootstrap resampling as per Section 2.6 and provided in Table S6. Here, the variance is not estimated using the influence function but as the sample variance of estimates on bootstrapped data. However, these are comparable provided a sufficient positivity constraint is applied (see Fig. S4). For direct comparison, the variance of the influence function is also provided in Table S6. For the null simulation, these are almost always similar (less than 15% relative difference) for both sample sizes when using GLMNet, and for the larger sample size 500,000 when using XGBoost. As expected, the bias and variance of estimators decrease with sample size for almost all estimands. The only 4 exceptions (out of 100), occur for the rarest trait in our dataset (sarcoidosis).
 
Last edited:
Back
Top Bottom